Unit 2 · Standard 6.DS.1
🔑 Understand Statistical Questions — Vocab Explorer
① Word Wall
Look at the picture, read the meaning, and tap 🔊 to hear each word.
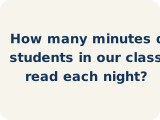
ES Preguntas estadísticas y datos
A statistical question expects varied answers that can be collected as data.
Una pregunta estadística espera respuestas variadas que se pueden recopilar como datos.

ES Pregunta estadística
A question answered with data that are expected to vary.
Una pregunta que se responde con datos que se espera que varíen.
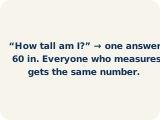
ES Pregunta no estadística
A question that does not anticipate variability in the data used to answer it. It may ask for one fact or measurement.
Una pregunta que no anticipa variabilidad en los datos usados para responderla. Puede pedir un solo dato o una medición.
ES Datos
Facts and numbers you collect, like answers to a survey.
Datos y números que recoges, como respuestas a una encuesta.

ES Variabilidad
How spread out the numbers are.
Qué tan separados están los números.
ES Encuesta
Collecting facts by asking people questions.
Recoger datos haciendo preguntas a las personas.

ES Distribución de datos
How the data looks: where it sits and how spread out it is.
Cómo se ven los datos: dónde están y qué tan separados están.
ES Diagrama de puntos
A number line with one dot for each data value.
Una recta numérica con un punto por cada valor de los datos.
② Match it
Tap a word, then tap its meaning.
③ Fill in the blank
Use the word bank to finish each sentence.
- 1A question that expects varied answers you can collect is a .
- 2A question that expects a variety of answers and is answered by collecting data is a .
- 3A question that does not anticipate variability in the data is a .
- 4Facts or numbers collected to answer a question are .
- 5How much the values in a data set differ from one another is the .
- 6A way to collect data by asking many people the same question is a .
- 7The way data values are spread out across a range is the .
- 8A number line that shows one dot for each data value is a .
④ Use it in a sentence
Pick one word and finish the sentence in your own words.
A is .