Choose Appropriate Measures
I can choose the best measure of center for a data set based on its shape.
How to Use This Deck
Click Present or press F11 for fullscreen. Use arrow keys to advance.
Blue boxes show exactly what to say, ask, and how long to spend.
Text boxes, polls, and drag-sort save automatically in the browser.
Press N or click 📝 in the toolbar for pacing tips and answers.
Launch the full HTML activity for independent practice.
File → Print or the print button for handout copies.
🎯 Content Objective / Objetivo de contenido
I can choose the best measure of center for a data set based on its shape.
Today's Flow
Total pacing: ~45 min · Progress bar at top tracks your place
LAUNCH
⏱ ~10 min
⏱️ 3 MIN · THINK-PAIR-SHARE
The students collected years of teaching experience. What would make you choose the median instead of the mean to describe this data?
Check for Understanding #1
Teacher: If >30% thumbs down, re-teach with a fresh example before moving on.
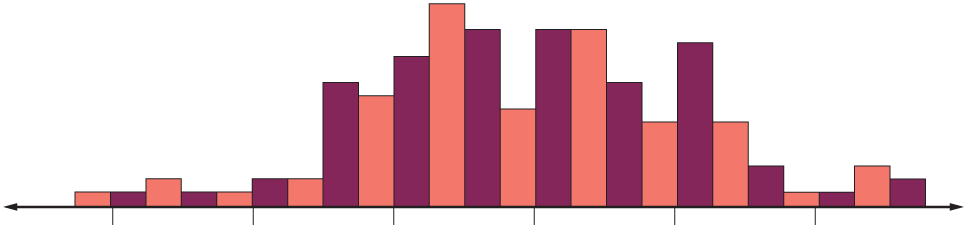
Teaching Experience
The students want to describe the data they collected about the number of years of teaching experience of the teachers in their school. Which measure of center and measure of variation should they use to summarize the data set?
Concept Launch
💡 Should I use the mean or the median?
The mean and the median both describe the center of a data set, but one fits better depending on the shape. When the data has an outlier (a value far from the rest), the median is usually the better choice.
Choosing Appropriate Measures of Center & Spread. 1. Symmetric Data (No Outliers): Use Mean and MAD. 2. Skewed Data (Has Outliers): Use Median and IQR (outliers distort the mean). 3. Compare distributions using both center (typical value) and spread (variability)
Check for Understanding #2
Teacher: If >30% thumbs down, re-teach with a fresh example before moving on.
Now it's your turn
VOCABULARY
⏱ ~8 min
| Term / Término | Meaning / Significado | Example / Ejemplo | Visual |
|---|---|---|---|
| Appropriate Measures of Center Medidas de centro apropiadas |
A mean, median, or mode chosen because it describes a data set fairly. Una media, mediana o moda elegida porque describe un conjunto de datos de manera justa. |
Use the median when an outlier would pull the mean too far. | |
| Mean Media |
The average. Add all the numbers, then divide by how many there are. El promedio. Suma todos los números y divide entre cuántos hay. |
Mean of 10, 20, 30 = (10+20+30) ÷ 3 = 20 | |
| Median Mediana |
The middle number when you put them in order. El número del medio cuando los pones en orden. |
Data: 5, 8, 12, 15, 20 → median is 12 (the 3rd of 5 values) | |
| Outlier Valor atípico |
A number that is much bigger or smaller than the rest. Un número mucho mayor o menor que los demás. |
Data: 12, 14, 13, 15, 45 → 45 is far from the cluster, so it is an outlier | |
| Skewed Sesgado |
When most data sits on one side with a tail on the other. Cuando la mayoría de los datos está de un lado con una cola del otro. |
Scores: 5, 6, 7, 8, 8, 35 → most scores are low, but 35 creates a tail to the right (skewed right) | |
| Data distribution Distribución de datos |
How the data looks: where it sits and how spread out it is. Cómo se ven los datos: dónde están y qué tan separados están. |
Symmetric = even on both sides. Skewed = bunched on one side with a tail |
Which Word Fits?
A center chosen because it describes the data fairly is an ___ ___ ___ ___.
Use It In a Sentence
Check for Understanding #3
Teacher: If >30% thumbs down, re-teach with a fresh example before moving on.
Turn & Talk — Launch
The students collected years of teaching experience. What would make you choose the median instead of the mean to describe this data?
👂 Listen For
Students choose the median (23) and identify 58 as an outlier that pulls the mean up to 27.6, making it unrepresentative.
Extend: Justify: by how much does removing the 58-point game change the mean? What does that show about outliers?
EXPLORE & PRACTICE
⏱ ~18 min
Visual Modeling Workspace
Use the drawing tray below to annotate the visual model. Teacher: say "Click to reveal" on key steps.
Explore Activity
Sort each sports data scenario into the correct category: Use Mean or Use Median.
✍️ Explore Discourse
What pattern do you notice about when median is the better choice?
Whiteboard Moment
Show your work clearly. Be ready to explain your thinking to a partner.
Turn & Talk — Explore
As you sort scenarios into 'Use Mean' or 'Use Median,' what clue tells you a data set needs the median instead of the mean?
👂 Listen For
A strong answer says the presence of an outlier or skew signals the median, while symmetric data with no outliers fits the mean.
Extend: Compare: give one sports example where the mean is the better choice and one where the median is. Justify each.
Practice Check A
A baseball player's batting averages over 6 seasons are: .280, .295, .290, .285, .300, .110. The .110 was an injury-shortened season. Which measure better represents the player's typical batting average?
✍️ Show Your Work
Explain why your answer is correct using today's vocabulary.
Practice Check B
A gymnast's scores are: 8.5, 8.8, 8.7, 8.6, 8.9. There are no outliers. Which measure best represents a typical score?
✍️ Show Your Work
Explain why your answer is correct using today's vocabulary.
Statistical vs Not Sort
Drag each question into the correct column.
✍️ Justify Your Thinking
Sort each measure into whether it describes the CENTER of the data or the SPREAD of the data.
A classmate turned in the work below. One step has a mistake. Read every step, find it, name it, and fix it.
Choose ONE option to show what you know — then do it in the workspace below.
Use evidence from today's lesson to complete each frame.
Today's key idea is: "Choosing Appropriate Measures of Center & Spread. 1. Symmetric Data (No Outliers): Use Mean and MAD. 2. Skewed Data (Has Outliers): Use Median and IQR (outliers distort the mean). 3. Compare distributions using both center (typical value) and spread (variability)" — and it works because ___.
Because Appropriate Measures of Center means ___, but a tricky part is ___, so I have to ___.
A common mistake with Appropriate Measures of Center is ___. It happens because ___, and the fix is ___.
I can prove my answer is correct by ___, using Mean to check my work.
✍️ TWR · WRITE 3 SENTENCES · 7 MIN
Choosing Appropriate Measures of Center & Spread. 1. Symmetric Data (No Outliers): Use Mean and MAD. 2. Skewed Data (Has Outliers): Use Median and IQR (outliers distort the mean). 3. Compare distributions using both center (typical value) and spread (variability) because ___
Choosing Appropriate Measures of Center & Spread. 1. Symmetric Data (No Outliers): Use Mean and MAD. 2. Skewed Data (Has Outliers): Use Median and IQR (outliers distort the mean). 3. Compare distributions using both center (typical value) and spread (variability) but ___
Choosing Appropriate Measures of Center & Spread. 1. Symmetric Data (No Outliers): Use Mean and MAD. 2. Skewed Data (Has Outliers): Use Median and IQR (outliers distort the mean). 3. Compare distributions using both center (typical value) and spread (variability) so ___
🌱 TWR · GROW THE KERNEL · 6 MIN
Answer these to add detail
Sentence starters (tap to use)
Student Workspace
Fill in the table using today's strategy.
| Column A | Column B |
|---|---|
✏️ Sketch Your Strategy
Differentiation Paths
Step-by-step with a worked model and sentence frames.
A gymnast's scores are: 8.5, 8.8, 8.7, 8.6, 8.9. There are no outliers. Which measure best represents a typical score?
A baseball player's batting averages over 6 seasons are: .280, .295, .290, .285, .300, .110. The .110 was an injury-shortened season. Which measure better represents the player's typical batting average?
Extension with error analysis or multi-step reasoning.
Partner Activity
Work with your partner on the practice problems at your differentiation path level. Explain each step using math vocabulary.
Check for Understanding #4
Teacher: If >30% thumbs down, re-teach with a fresh example before moving on.
Real-World Connection
🌍 Math in the Wild
A sports reporter writes: 'The average ticket price for the playoffs is $85.' The actual prices are: $45, $50, $48, $52, $55, $260. The $260 ticket is a courtside seat.
✍️ Connection Reasoning
Is $85 a fair way to describe a 'typical' ticket price? What measure should the reporter use?
The reporter used the ___, which is ___. A better measure would be the ___ (about ___) because ___. The courtside seat at $260 is an ___ that pulls the mean ___.
Turn & Talk — Connect
A reporter writes 'the average playoff ticket is $85,' but prices are $45, $50, $48, $52, $55, $260. Is $85 a fair 'typical' price? What measure should the reporter use?
👂 Listen For
Students explain $85 is misleading because the $260 courtside seat skews the mean upward, and the median (~$51) better reflects a typical ticket.
Extend: Critique: could the reporter be using the mean ON PURPOSE to make tickets sound pricier? Argue whether that is honest.
Summarize: Choose Appropriate Measures
Choosing Appropriate Measures of Center & Spread. 1. Symmetric Data (No Outliers): Use Mean and MAD. 2. Skewed Data (Has Outliers): Use Median and IQR (outliers distort the mean). 3. Compare distributions using both center (typical value) and spread (variability)
In your own words:
CLOSURE & REFLECT
⏱ ~8 min
Today I learned that ___ because ___.
One thing I am still not sure about is ___.
Data set: 15, 18, 16, 17, 15, 72. Which measure of center best represents the data?
Bonus Exit Check
A runner's mile times are: 7:10, 7:15, 7:12, 7:20, 12:00. The 12:00 was due to a cramp. Which measure best represents a typical mile?
✍️ Show Your Work
Explain why your answer is correct using today's vocabulary.
Reflection & Self-Assessment
Continue Learning
Launch the Full Interactive Activity
Students continue practice in the HTML lesson engine with auto-check, hints, and differentiation.
Family Connection
Share tonight's family homework and discuss one vocabulary word at home.
Open Family Homework ↗Teacher Notes
⏱️ Pacing Guide
- Launch & vocab: 12 min
- I Do / We Do / You Do: 15 min
- Explore & practice: 15 min
- Connect & closure: 8 min
Total: ~45 min
🎯 Listen For · Common Errors
• Students choose the median (23) and identify 58 as an outlier that pulls the mean up to 27.6, making it unrepresentative.
• A strong answer says the presence of an outlier or skew signals the median, while symmetric data with no outliers fits the mean.
• Students explain $85 is misleading because the $260 courtside seat skews the mean upward, and the median (~$51) better reflects a typical ticket.
• Students choose the median (~16.5), identify 72 as the outlier, and explain it would inflate the mean.
Common mistake: A common mistake in Appropriate Measures is defaulting to the mean just because "it uses all the data," without first checking whether an outlier or skewed shape is present. For example, given a player's points per game 14, 16, 15, 17, 16, 58, a student calculates the mean (136 ÷ 6 ≈ 22.7) and reports that as the typical game — but 58 is far from the cluster of 14–17, so it pulls the mean above 5 of the 6 games. The median (16) actually represents a typical game here. Before choosing a measure, always scan the data for an outlier or a long tail first: only use the mean once you've confirmed the data has neither.
Answer Key (Teacher Appendix)
Hide this slide during presentation or move to the end of your copy.
✓ Practice 1: Median, because the .110 outlier pulls the mean down — The .110 is an outlier that pulls the mean down to .260. The median (.2875) better represents typical performance because it isn't affected by the extreme value.
✓ Practice 2: Mean — The data is symmetric with no outliers, so the mean (8.7) best represents the typical score.
✓ Practice 3: Median — the outlier 12:00 pulls the mean too high — The 12:00 is an outlier that pulls the mean up. The median (7:15) better represents the runner's typical time.
✓ Practice 4: Median (7) — the outlier 50 inflates the mean — The mean (13.8) is higher than 5 of the 6 values because the outlier 50 pulls it up. The median (7) better represents a typical value.
✓ Exit ticket: Median, because 72 is an outlier — The value 72 is an outlier. The mean (25.5) is pulled high by 72 and doesn't represent the typical values. The median (16.5) is a better measure of center.