Learn It
How spread out is the data?
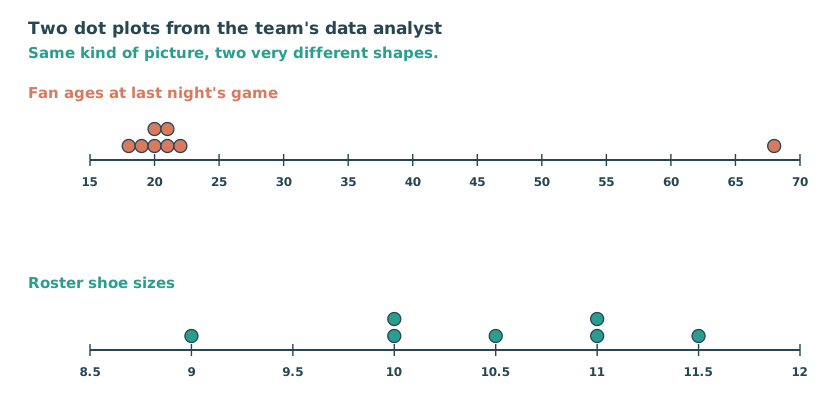
A measure of center like the median tells you where the data sits. It does not tell you how far apart the values are. Two classes can share the same median and still look nothing alike. Range and interquartile range are the two numbers that describe that spread.
Picture itSee what the math looks like before you read about it
Watch me solve itI do — read one step at a time
- Here are 20 history test scores in order: 68, 70, 73, 74, 75, 76, 77, 80, 82, 83, 84, 85, 86, 86, 88, 88, 90, 90, 93, 94. Ordering them first is what makes every step after this possible.
- : I subtract the least value from the greatest. 94 − 68 = 26. The scores span 26 points from end to end.
- Now the . The median splits the 20 scores into two halves of 10. The median is halfway between the 10th and 11th values:(83 + 84) ÷ 2 = 83.5
- Q1 is the median of the lower 10 values: halfway between 75 and 76, so Q1 = 75.5. Q3 is the median of the upper 10: halfway between 88 and 88, so Q3 = 88.
- : IQR = Q3 − Q1 = 88 − 75.5 = 12.5. The middle half of the students' scores differed by only 12.5 points, even though the full was 26.
Watch out — mistakes students make here
- 28 is the midpoint between 20 and 36 — that is a center, not a width.
- 50 − 10 = 40 is the RANGE, which uses the extremes. The IQR uses only the quartiles.
- The IQR is a difference, not a sum. Subtract Q1 from Q3.
Try it with meWe do — you answer first, then check
Same steps, new numbers.
- Class A's box plot reads: least 62, Q1 74, median 81, Q3 87, greatest 90. Find the first.
- = 90 − 62 = 28 points from the lowest score to the highest.
- Now the IQR: subtract Q1 from Q3. IQR = 87 − 74 = 13 points across the middle half.
- Say what each one means: the whole class's scores span 28 points, but the middle half of the class is packed into 13 points.
On your ownYou do — solve this one by yourself
Before you start, remember:
- Class B's box plot reads: least 70, Q1 76, median 81, Q3 84, greatest 90.
- Find the : greatest − least.
- Find the IQR: Q3 − Q1.
- Class A and Class B have the SAME median, 81. Which class's scores are less spread out — and how do your two numbers show it?
Solve: A box plot shows: least 68, Q1 75.5, median 83.5, Q3 88, greatest 94. What are the and the IQR?
My answer
Stuck? Open one hint at a time.
Hint 1
Do the whiskers first: greatest − least.
Hint 2
Then the box: Q3 − Q1.
Hint 3
94 − 68 and 88 − 75.5.
Check my answer
Range = 94 − 68 = 26. IQR = 88 − 75.5 = 12.5. The range covers the whole span; the IQR covers only the box.
Turn & TalkSay it out loud with a partner
Two classes have the same median score, 81. Can you tell which class did better? What else would you need to know?
Try starting with:
- The medians are the same, so I still need to know how ___ the scores are.Las medianas son iguales, así que todavía necesito saber qué tan ___ están los puntajes.
- I would want to compare the ___ and the ___ of each class.Querría comparar el ___ y el ___ de cada clase.