Determine Equivalent Ratios Using Tables
I can use a ratio table to find equivalent ratios.
How to Use This Deck
Click Present or press F11 for fullscreen. Use arrow keys to advance.
Blue boxes show exactly what to say, ask, and how long to spend.
Text boxes, polls, and drag-sort save automatically in the browser.
Press N or click 📝 in the toolbar for pacing tips and answers.
Launch the full HTML activity for independent practice.
File → Print or the print button for handout copies.
🎯 Content Objective / Objetivo de contenido
I can use a ratio table to find equivalent ratios.
Today's Flow
Total pacing: ~45 min · Progress bar at top tracks your place
LAUNCH
⏱ ~10 min
⏱️ 3 MIN · THINK-PAIR-SHARE
The clay recipe uses 2 cups of baking soda for every 1 cup of cornstarch. If Brian doubles the batch, what happens to each ingredient — and what stays the same?
Check for Understanding #1
Teacher: If >30% thumbs down, re-teach with a fresh example before moving on.
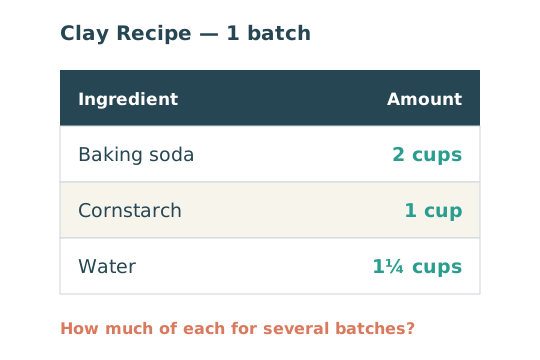
Making Homemade Clay
Brian will use the recipe shown to make clay. He needs to make multiple batches of clay. How can Brian determine how much baking soda and cornstarch he needs for multiple batches of clay to get the same consistency?
Concept Launch
💡 How do ratio tables work?
A ratio table lists equal ratios in rows. To make a new row, you multiply BOTH numbers by the same amount, called the scale factor.
Equivalent Ratios & Ratio Tables. 1. Multiply or divide both terms in a ratio by the same non-zero scale factor. 2. In a ratio table, rows and columns maintain the same proportional unit rate. 3. Use additive or multiplicative patterns to find missing values in the table
Check for Understanding #2
Teacher: If >30% thumbs down, re-teach with a fresh example before moving on.
Now it's your turn
VOCABULARY
⏱ ~8 min
| Term / Término | Meaning / Significado | Example / Ejemplo | Visual |
|---|---|---|---|
| Ratio Tables Tablas de razones |
Tables that organize pairs of equivalent ratios. Tablas que organizan pares de razones equivalentes. |
2:3, 4:6, and 6:9 belong in the same ratio table. | |
| Ratio table Tabla de razones |
A table of equal ratios that shows a pattern. Una tabla de razones iguales que muestra un patrón. |
Cups of juice: 2, 4, 6 | Cups of water: 3, 6, 9 | |
| Equivalent ratio Razón equivalente |
Two ratios that mean the same thing, like 1:2 and 2:4. Dos razones que significan lo mismo, como 1:2 y 2:4. |
2:3 = 4:6 = 6:9 | |
| Scale factor Factor de escala |
The number you multiply both parts of a ratio by to get an equal ratio. El número por el que multiplicas ambas partes de una razón para obtener una razón igual. |
2:3 × 2 → 4:6 (scale factor is 2) | |
| Pattern Patrón |
A rule that numbers follow again and again. Una regla que los números siguen una y otra vez. |
Each row adds 2 cups juice and 3 cups water | |
| Additive pattern Patrón aditivo |
Building new rows of a ratio table by adding each column's own constant amount, so the two columns grow together. Formar nuevas filas de una tabla de razones sumando a cada columna su propia cantidad constante, para que las dos columnas crezcan juntas. |
2:3 → 4:6 → 6:9 (add 2 and 3 each time) |
Vocabulary — True or False?
Which statements correctly use Equivalent ratio?
Fix the False One
Which Word Fits?
A table whose every row holds the same comparison is a ___ ___.
Use It In a Sentence
Check for Understanding #3
Teacher: If >30% thumbs down, re-teach with a fresh example before moving on.
Turn & Talk — Launch
The clay recipe uses 2 cups of baking soda for every 1 cup of cornstarch. If Brian doubles the batch, what happens to each ingredient — and what stays the same?
👂 Listen For
A strong answer says BOTH quantities are multiplied by the same number (4), so 2:3 becomes 8:12, keeping the ratio equivalent.
Extend: Explain why you cannot just add 4 to the mix and 4 to the milk to feed 4 times as many people. Use the words equivalent ratio.
EXPLORE & PRACTICE
⏱ ~18 min
Visual Modeling Workspace
Use the drawing tray below to annotate the visual model. Teacher: say "Click to reveal" on key steps.
Explore Activity
Chef Reyes's pancake recipe uses 2 cups of mix for every 3 cups of milk. Complete the ratio table to scale the recipe for more students.
✍️ Explore Discourse
How did you find each new row in the pancake ratio table? If someone asked for 10 batches instead of 4, would counting up by adding 2 and 3 each row still be a fast way to find the answer?
Whiteboard Moment
Show your work clearly. Be ready to explain your thinking to a partner.
Turn & Talk — Explore
In your pancake ratio table, how did you find each new row from the 2:3 starting row?
👂 Listen For
Listen for use of a scale factor (multiplying both parts) and recognition that every row in the table is an equivalent ratio showing the same pattern.
Extend: Compare the additive pattern (add 2 and 3 each row) with the scale-factor method. Why do BOTH give correct rows for this table?
Practice Check A
In a ratio table, the ratio of sugar to butter is 3:2. If you use 12 cups of sugar, how many cups of butter do you need?
✍️ Show Your Work
Explain why your answer is correct using today's vocabulary.
Practice Check B
A ratio table shows 5:8, 10:16, 15:24. What scale factor was used from the first row to the third row?
✍️ Show Your Work
Explain why your answer is correct using today's vocabulary.
Equivalent Ratio Sort
Complete the interactive activity using today's strategy.
✍️ Justify Your Thinking
Which rows belong in a ratio table for 3:4? Sort them into correct and incorrect.
A classmate turned in the work below. One step has a mistake. Read every step, find it, name it, and fix it.
Choose ONE option to show what you know — then do it in the workspace below.
Use evidence from today's lesson to complete each frame.
Today's key idea is: "Equivalent Ratios & Ratio Tables. 1. Multiply or divide both terms in a ratio by the same non-zero scale factor. 2. In a ratio table, rows and columns maintain the same proportional unit rate. 3. Use additive or multiplicative patterns to find missing values in the table" — and it works because ___.
Because Ratio Tables means ___, but a tricky part is ___, so I have to ___.
A common mistake with Ratio Tables is ___. It happens because ___, and the fix is ___.
I can prove my answer is correct by ___, using Ratio table to check my work.
✍️ TWR · WRITE 3 SENTENCES · 7 MIN
Equivalent Ratios & Ratio Tables. 1. Multiply or divide both terms in a ratio by the same non-zero scale factor. 2. In a ratio table, rows and columns maintain the same proportional unit rate. 3. Use additive or multiplicative patterns to find missing values in the table because ___
Equivalent Ratios & Ratio Tables. 1. Multiply or divide both terms in a ratio by the same non-zero scale factor. 2. In a ratio table, rows and columns maintain the same proportional unit rate. 3. Use additive or multiplicative patterns to find missing values in the table but ___
Equivalent Ratios & Ratio Tables. 1. Multiply or divide both terms in a ratio by the same non-zero scale factor. 2. In a ratio table, rows and columns maintain the same proportional unit rate. 3. Use additive or multiplicative patterns to find missing values in the table so ___
🌱 TWR · GROW THE KERNEL · 6 MIN
Answer these to add detail
Sentence starters (tap to use)
Student Workspace
Chef Reyes's pancake recipe uses 2 cups of mix for every 3 cups of milk. Complete the ratio table to scale the recipe for more students.
| Batches | Cups of Mix | Cups of Milk |
|---|---|---|
| 1 | 2 | 3 |
| 2 | ||
| 3 | ||
| 4 |
✏️ Sketch Your Strategy
Differentiation Paths
Step-by-step with a worked model and sentence frames.
A recipe uses 3 eggs for every 5 cups of flour. How many eggs are needed for 15 cups of flour?
Core practice aligned to the standard.
Extension with error analysis or multi-step reasoning.
Partner Activity
Work with your partner on the practice problems at your differentiation path level. Explain each step using math vocabulary.
Check for Understanding #4
Teacher: If >30% thumbs down, re-teach with a fresh example before moving on.
Real-World Connection
🌍 Math in the Wild
A juice bar makes a Berry Blast smoothie with 3 scoops of frozen berries for every 2 cups of yogurt. A customer orders enough for a party of 20 people, and each person gets one serving. The juice bar needs to use a ratio table to figure out how many scoops and cups to prepare.
✍️ Connection Reasoning
The recipe uses 3 scoops of berries for every ___ cups of yogurt, so 20 servings need ___ scoops of berries and ___ cups of yogurt.
The recipe uses 3 scoops of berries for every ___ cups of yogurt, so 20 servings need ___ scoops of berries and ___ cups of yogurt.
Turn & Talk — Connect
The juice bar makes a smoothie with 3 scoops of berries for every 2 cups of yogurt and needs enough for 20 people. How is this the same as our pancake table?
👂 Listen For
A strong answer connects both scenarios as scaling a ratio with a scale factor, keeping berries-to-yogurt (3:2) equivalent across every serving.
Extend: If the juice bar suddenly needs servings for 30 people instead of 20, generalize how the scale factor changes and what stays the same.
Summarize: Determine Equivalent Ratios Using Tables
Equivalent Ratios & Ratio Tables. 1. Multiply or divide both terms in a ratio by the same non-zero scale factor. 2. In a ratio table, rows and columns maintain the same proportional unit rate. 3. Use additive or multiplicative patterns to find missing values in the table
In your own words:
CLOSURE & REFLECT
⏱ ~8 min
Today I learned that ___ because ___.
One thing I am still not sure about is ___.
A salad dressing recipe uses 2 tablespoons of oil for every 5 tablespoons of vinegar. How many tablespoons of oil are needed for 20 tablespoons of vinegar?
Bonus Exit Check
A recipe uses 3 eggs for every 5 cups of flour. How many eggs are needed for 15 cups of flour?
✍️ Show Your Work
Explain why your answer is correct using today's vocabulary.
Reflection & Self-Assessment
Continue Learning
Launch the Full Interactive Activity
Students continue practice in the HTML lesson engine with auto-check, hints, and differentiation.
Family Connection
Share tonight's family homework and discuss one vocabulary word at home.
Open Family Homework ↗Teacher Notes
⏱️ Pacing Guide
- Launch & vocab: 12 min
- I Do / We Do / You Do: 15 min
- Explore & practice: 15 min
- Connect & closure: 8 min
Total: ~45 min
🎯 Listen For · Common Errors
• A strong answer says BOTH quantities are multiplied by the same number (4), so 2:3 becomes 8:12, keeping the ratio equivalent.
• Listen for use of a scale factor (multiplying both parts) and recognition that every row in the table is an equivalent ratio showing the same pattern.
• A strong answer connects both scenarios as scaling a ratio with a scale factor, keeping berries-to-yogurt (3:2) equivalent across every serving.
• Listen for students naming a specific strategy tied to 6.AT.3a — not just "I multiplied." They should connect steps to the key idea.
Common mistake: A common mistake in Ratio Tables is scaling only ONE part of the ratio, or adding the scale factor to a part instead of multiplying by it — for example, turning 2:3 into 6:3 (multiplying only the first number by 3 and forgetting the second) or into 4:5 (adding the scale factor 2 to the second number instead of multiplying, since 3+2=5 but 3×2=6). Before you submit, multiply BOTH numbers by the same scale factor and check that your new ratio simplifies back to the original.
Answer Key (Teacher Appendix)
Hide this slide during presentation or move to the end of your copy.
✓ Practice 1: 8 — Scale factor: 12 ÷ 3 = 4. Multiply butter by 4: 2 × 4 = 8 cups of butter.
✓ Practice 2: 3 — From 5 to 15: 15 ÷ 5 = 3. From 8 to 24: 24 ÷ 8 = 3. The scale factor is 3.
✓ Practice 3: 9 — The scale factor is 15 ÷ 5 = 3. Multiply the eggs by 3: 3 × 3 = 9 eggs.
✓ Practice 4: 6:10 — 6:10 simplifies to 3:5, not 4:5. The other ratios (8:10, 12:15, 16:20) all simplify to 4:5.
✓ Exit ticket: 8 — Scale factor: 20 ÷ 5 = 4. Multiply oil by 4: 2 × 4 = 8 tablespoons of oil.