Touch and changeToca y cambia
Move, type, tap, or drag in the model. Watch what changes.Mueve, escribe, toca o arrastra en el modelo. Observa qué cambia.
Unit 8 · 6.AT.9
Write and Represent Inequalities · Lesson 8-4
English: Use the pictures and short steps. Ask questions; let your student do the thinking. Español: Usen los dibujos y los pasos cortos. Hagan preguntas; dejen que su estudiante piense.
Tonight we write inequalities. An inequality compares two amounts with the signs <, >, ≤, or ≥, when many values are allowed instead of just one.
Esta noche escribimos desigualdades. Una desigualdad compara dos cantidades con los signos <, >, ≤ o ≥, cuando se permiten muchos valores en lugar de uno solo.
Follow the picture pathSigan la ruta visual
Real clue: 'The suspect is at least 18 years old.' We let a stand for the age.
Pista real: 'El sospechoso tiene al menos 18 años.' Usamos a para representar la edad.
Think about what the phrase allows.
Piensa en lo que permite la frase.
'At least 18' means 18 is allowed AND any number bigger.
'Al menos 18' significa que 18 está permitido Y cualquier número mayor.
Choose the symbol.
Elige el símbolo.
Because 18 itself is included, we use ≥ (greater than or equal to).
Como el 18 mismo está incluido, usamos ≥ (mayor o igual que).
Write it: a ≥ 18.
Escríbelo: a ≥ 18.
So a could be 18, 19, 20, and up — not just one number.
Así que a podría ser 18, 19, 20 y más — no solo un número.
Listen for "inequality" (desigualdad) — a sentence that compares with <, >, ≤, or ≥, not a single answer.
Escucha la palabra "desigualdad" — una oración que compara con <, >, ≤ o ≥, no una sola respuesta.
Listen for "at least / at most" (al menos / a lo más) — these include the number (≥ or ≤).
Escucha "al menos / a lo más" — estas incluyen el número (≥ o ≤).
Ask "Is that exact number allowed, yes or no?" The answer decides between > / < and ≥ / ≤.
Pregunta "¿Ese número exacto está permitido, sí o no?" La respuesta decide entre > / < y ≥ / ≤.
Use the same interactive model from the lesson. Change it, notice the pattern, and explain what the model shows.Usa el mismo modelo interactivo de la lección. Cámbialo, observa el patrón y explica lo que muestra.
Move, type, tap, or drag in the model. Watch what changes.Mueve, escribe, toca o arrastra en el modelo. Observa qué cambia.
Record one equation, value, or relationship you can see.Escribe una ecuación, un valor o una relación que puedas ver.
I notice ___ changes when ___ changes. This shows ___.Noto que ___ cambia cuando ___ cambia. Esto muestra ___.
Writing & Representing Inequalities. Formula: < (less) | > (greater) | ≤ (at most / ≤) | ≥ (at least / ≥). 1. 'At least', 'minimum', 'no less than' translate to ≥ (greater than or equal to). 2. 'At most', 'maximum', 'no more than' translate to ≤ (less than or equal to). 3. 'More than' is >; 'Fewer than' / 'Less than' is <
A quick, no-timer review game for tonight's lesson — sort, match, and choose. A wrong answer just gives a hint and lets your student try again. Un juego de repaso sin reloj para la lección de hoy — clasificar, emparejar y elegir. Si se equivocan, reciben una pista y pueden intentar de nuevo.
↗ Play full screen ↗ Jugar en pantalla completa
Tap a card to flip. Use these words when you talk about the math together. Toquen una tarjeta para voltearla. Usen estas palabras cuando hablen de la matemática juntos.
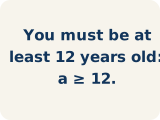
Escribir desigualdades
Represent a range of possible values with <, >, ≤, or ≥.
Representar un rango de valores posibles con <, >, ≤ o ≥.
📌 You must be at least 12 years old: a ≥ 12.

Desigualdad
A math sentence that compares two sides with <, >, ≤, or ≥.
Una oración matemática que compara dos lados con <, >, ≤ o ≥.
📌 x > 5 means x can be 6, 7, 8, ... — any number greater than 5
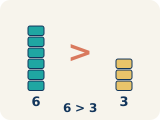
Mayor que
The > sign, showing one number is bigger.
El signo >, que muestra que un número es mayor.
📌 8 > 3 — eight is larger than three
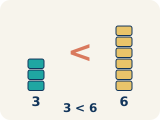
Menor que
The < sign, showing one number is smaller.
El signo <, que muestra que un número es menor.
📌 2 < 7 — two is smaller than seven
Al menos / A lo más
'At least' means ≥. 'At most' means ≤.
'Al menos' significa ≥. 'Como máximo' significa ≤.
📌 'At least 10 players' → p ≥ 10 (could be 10, 11, 12, ...); 'At most 5 tries' → t ≤ 5 (could be 5, 4, 3, ...)
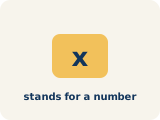
Variable
A letter that stands for a number that is unknown or can change.
Una letra que representa un número desconocido o que puede cambiar.
📌 In x > 5, the letter x stands for any number greater than 5.
No más de
A phrase meaning less than or equal to (≤).
Una frase que significa menor o igual que (≤).
📌 “No more than 8 people” means people ≤ 8.
Detective Navarro has a new clue: 'A bag holds fewer than 10 items.' Write the inequality together.
La detective Navarro tiene una nueva pista: 'Una bolsa tiene menos de 10 objetos.' Escriban juntos la desigualdad.
Work side by side. You ask questions; your student does the thinking. Trabajen juntos. Tú haces preguntas; tu estudiante piensa.
Pick a letter for the unknown. Let n be the number of items.
Elijan una letra para la incógnita. Que n sea el número de objetos.
Is 10 itself allowed? 'Fewer than 10' does NOT include 10, so we use <.
¿Está permitido el 10 mismo? 'Menos de 10' NO incluye el 10, así que usamos <.
Check together: name some numbers that fit n < 10.
Revisen juntos: nombren algunos números que cumplan n < 10.
Do these together. Start at ★ and climb to ★★★ when ready. Háganlos juntos. Empiecen en ★ y suban a ★★★ cuando estén listos.
Which inequality represents: 'The temperature is less than 40 degrees'?
A. t < 40
Which inequality represents: 'You must be at least 48 inches tall to ride'?
A. h ≥ 48
A parking garage charges if your stay is more than 2 hours. Which inequality represents times t that are charged?
A. t > 2
A clue says the suspect carried at least 12 stolen gems. Which inequality shows the number g of gems?
A. g ≥ 12
Write two different real-world situations: one that uses > and one that uses ≥. Explain why the situations need different symbols even though both mean 'bigger.'
⏱️ Plan on about 15–20 minutes for the 6 problems below. The extra practice at the bottom is optional. ⏱️ Calculen unos 15–20 minutos para los 6 problemas de abajo. La práctica extra al final es opcional.
A few problems to practice together. Each one has a step-by-step guide, a picture to draw on, and a space to show your work. Use Check This Problem for instant feedback — no need to finish everything at once. Unos problemas para practicar juntos. Cada uno tiene una guía paso a paso, un dibujo para trabajar y un espacio para mostrar el trabajo. Usen Revisar esta pregunta para retroalimentación al instante — no tienen que terminar todo de una vez.
Easier problems to practice the idea. Do these first together. Problemas más fáciles para practicar la idea. Hagan estos primero juntos.
Each case clue describes a boundary. Drag every scenario into the inequality symbol it matches.Cada pista del caso describe un límite. Arrastra cada situación al símbolo de desigualdad que le corresponde.
👪 On a phone, use Move to. On a computer, drag cards or tap a card then tap a column.👪 En el teléfono usen Mover a. En la computadora arrastren o toquen tarjeta y columna.
Match each detective clue phrase to its inequality symbol.Une cada frase de pista del detective con su símbolo de desigualdad.
👪 Say each term out loud, then talk through which match makes sense before choosing.👪 Digan cada término en voz alta y hablen de cuál pareja tiene sentido antes de elegir.
Identify the key phrase, symbol, and write the inequality for each situation.Identifica la frase clave y el símbolo, y escribe la desigualdad de cada situación.
👪 Encourage your student to show work on paper if a box feels tricky.👪 Animen a mostrar el trabajo en papel si una casilla se siente difícil.
| Situation | Key Phrase | Symbol | Inequality |
|---|---|---|---|
| A package weighs less than 50 pounds. | less than | < | w < 50 |
| You need at least $25 to buy the game. | at least | ≥ | m ≥ 25 |
| No more than 30 students can join the club. | no more than | ≤ | s ≤ 30 |
Try these once the warm-up feels easy. It's okay to use the steps and pictures. Intenten estos cuando el calentamiento sea fácil. Está bien usar los pasos y los dibujos.
For each situation, decide if it needs an equation or inequality and explain why.Para cada situación, decide si necesita una ecuación o una desigualdad y explica por qué.
👪 Encourage your student to show work on paper if a box feels tricky.👪 Animen a mostrar el trabajo en papel si una casilla se siente difícil.
| Equation or Inequality? | Model | Why? |
|---|---|---|
| A detective has exactly 12 cases. | c = 12 | 'Exactly' means one specific value → equation |
| A detective has more than 12 cases. | c > 12 | 'More than' means many possible values → inequality |
| A detective has at most 12 cases. | c ≤ 12 | 'At most' means 12 or fewer → inequality with ≤ |
Write two different real-world situations: one that uses > and one that uses ≥. Explain why the situations need different symbols even though both mean 'bigger.'Escribe dos situaciones diferentes de la vida real: una que use > y otra que use ≥. Explica por qué las situaciones necesitan símbolos distintos aunque las dos signifiquen 'más grande'.
👪 A complete sentence with math vocabulary is the goal — not a perfect paragraph.👪 Una oración completa con vocabulario matemático es la meta — no un párrafo perfecto.
A parking garage charges if your stay is more than 2 hours. Which inequality represents times t that are charged?Un estacionamiento cobra si tu estancia dura más de 2 horas. ¿Qué desigualdad representa los tiempos t que se cobran?
👪 Read the question together, then let your student pick an answer before you discuss why.👪 Lean la pregunta juntos; dejen que su estudiante elija antes de hablar del porqué.
Optional. Only if your student wants more — these are bonus problems. Opcional. Solo si tu estudiante quiere más — son problemas adicionales.
Which inequality represents: 'The temperature is less than 40 degrees'?¿Qué desigualdad representa: 'La temperatura es menor que 40 grados'?
👪 Read the question together, then let your student pick an answer before you discuss why.👪 Lean la pregunta juntos; dejen que su estudiante elija antes de hablar del porqué.
Which inequality represents: 'A store can hold no more than 75 people'?¿Qué desigualdad representa: 'Una tienda puede albergar no más de 75 personas'?
👪 Read the question together, then let your student pick an answer before you discuss why.👪 Lean la pregunta juntos; dejen que su estudiante elija antes de hablar del porqué.
Which inequality represents: 'The speed limit is more than 25 mph'?¿Qué desigualdad representa: 'El límite de velocidad es más de 25 mph'?
👪 Read the question together, then let your student pick an answer before you discuss why.👪 Lean la pregunta juntos; dejen que su estudiante elija antes de hablar del porqué.
Which inequality represents: 'You must be at least 48 inches tall to ride'?¿Qué desigualdad representa: 'Debes medir al menos 48 pulgadas de estatura para subir'?
👪 Read the question together, then let your student pick an answer before you discuss why.👪 Lean la pregunta juntos; dejen que su estudiante elija antes de hablar del porqué.
A witness reports that fewer than 5 people entered the building. Which inequality shows the number n of people?Un testigo informa que menos de 5 personas entraron al edificio. ¿Qué desigualdad muestra el número n de personas?
👪 Read the question together, then let your student pick an answer before you discuss why.👪 Lean la pregunta juntos; dejen que su estudiante elija antes de hablar del porqué.
A clue says the suspect carried at least 12 stolen gems. Which inequality shows the number g of gems?Una pista dice que el sospechoso llevaba al menos 12 gemas robadas. ¿Qué desigualdad muestra el número g de gemas?
👪 Read the question together, then let your student pick an answer before you discuss why.👪 Lean la pregunta juntos; dejen que su estudiante elija antes de hablar del porqué.
Test x = 10 in each inequality. Sort by whether it works.Prueba x = 10 en cada desigualdad. Clasifícalas según si funciona.
👪 On a phone, use Move to. On a computer, drag cards or tap a card then tap a column.👪 En el teléfono usen Mover a. En la computadora arrastren o toquen tarjeta y columna.
💡 Substitute 10 for x and check if the statement is true.Sustituye 10 por x y revisa si el enunciado es verdadero.
💡 Remember: ≥ means 10 counts (10 ≥ 10 is true), but > means 10 does not count (10 > 10 is false).Recuerda: ≥ significa que el 10 cuenta (10 ≥ 10 es verdadero), pero > significa que el 10 no cuenta (10 > 10 es falso).
A digital scratch pad to draw models, line up decimals, and show your work. It opens in a new tab so you keep your place on this homework. Una pizarra digital para dibujar modelos, alinear decimales y mostrar el trabajo. Se abre en una pestaña nueva para no perder tu lugar en esta tarea.
🧮 Open the Math Workbench ↗ 🧮 Abrir la Pizarra de matemáticas ↗
What is the key phrase — 'at least,' 'at most,' 'more than,' or 'fewer than'?
¿Cuál es la frase clave — 'al menos,' 'a lo más,' 'más de' o 'menos de'?
Is the exact number allowed? That tells us if we use the line under the symbol.
¿Está permitido el número exacto? Eso nos dice si usamos la línea debajo del símbolo.
Can you name two numbers that would fit this rule?
¿Puedes nombrar dos números que cumplan esta regla?
'At least 18' means more than 18, so use >.
'Al menos 18' significa más de 18, así que usa >.
An inequality has just one answer, like an equation.
Una desigualdad tiene solo una respuesta, como una ecuación.
The symbols < and > mean the same as ≤ and ≥.
Los símbolos < y > significan lo mismo que ≤ y ≥.
These links go to specific videos and lessons about tonight's topic — not general math pages. Estos enlaces van a videos y lecciones específicas sobre el tema de hoy — no páginas generales.
Reinforce tonight's topic with a quick family game. You ask; your student decides! Refuercen el tema de hoy con un juego rápido en familia. ¡Ustedes preguntan; su estudiante decide!
🎮 Play together! Test values: substitute to see if the inequality is true. 🎮 ¡Jueguen juntos! Prueben valores: sustituyan para ver si la desigualdad es verdadera.
High five! Whether every answer was perfect or not, you showed up for your student tonight. That matters.
¡Chócalas! No importa si cada respuesta fue perfecta — estuviste con tu estudiante esta noche. Eso importa.
Answers save automatically on this device. Tap Check This Problem anytime. Las respuestas se guardan solas en este dispositivo. Toquen Revisar esta pregunta cuando quieran.
Signed on:Firmado el:
Note to teacher / Nota para el maestro:
This certifies that the homework for was completed and reviewed collaboratively.
Parent/Guardian Signature
Date