Equations and Inequalities Problem Solving
I can model and solve real-world problems using equations and inequalities.
How to Use This Deck
Click Present or press F11 for fullscreen. Use arrow keys to advance.
Blue boxes show exactly what to say, ask, and how long to spend.
Text boxes, polls, and drag-sort save automatically in the browser.
Press N or click 📝 in the toolbar for pacing tips and answers.
Launch the full HTML activity for independent practice.
File → Print or the print button for handout copies.
🎯 Content Objective / Objetivo de contenido
I can model and solve real-world problems using equations and inequalities.
Today's Flow
Total pacing: ~45 min · Progress bar at top tracks your place
LAUNCH
⏱ ~10 min
⏱️ 3 MIN · THINK-PAIR-SHARE
Before solving a word problem, how do you decide whether to model it with an equation or an inequality?
Check for Understanding #1
Teacher: If >30% thumbs down, re-teach with a fresh example before moving on.
Case File: The Final Puzzle
Detective Santos is closing a complex case. She has collected equations and inequalities from different parts of the investigation. One clue says: 'The total value of stolen items divided equally among 4 accomplices gave each person $85.' Another says: 'The lookout earned less than $50.' She must model both clues mathematically and check if the answers are reasonable. Can you help?
Concept Launch
💡 Should I model this problem with an equation or an inequality?
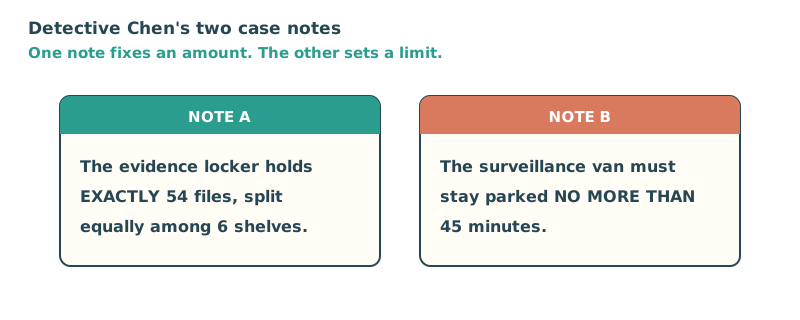
To model means to write a real situation as math. I use an equation when there is one exact total, and an inequality when there is a limit or a range of allowed values.
Modeling Real-World Scenarios with Equations & Inequalities. 1. Define the variable and units in the scenario. 2. Look for keywords: 'equals/is' (=) vs 'at least/limit' (≥, ≤, >, <). 3. Write the algebraic model, solve with inverse operations, and check in context
Check for Understanding #2
Teacher: If >30% thumbs down, re-teach with a fresh example before moving on.
Now it's your turn
VOCABULARY
⏱ ~8 min
| Term / Término | Meaning / Significado | Example / Ejemplo | Visual |
|---|---|---|---|
| Equations and Inequalities Problem Solving Resolución de problemas con ecuaciones y desigualdades |
Use an equation for one exact value or an inequality for a range of values in a real situation. Usar una ecuación para un valor exacto o una desigualdad para un rango de valores en una situación real. |
Exactly $20: 4x = 20. At most $20: 4x ≤ 20. | |
| Model Modelar |
To show a real-life situation with an equation or inequality. Mostrar una situación real con una ecuación o desigualdad. |
'Twice a number is 18' → 2n = 18 — the equation models the words | |
| Equation Ecuación |
A math sentence with an equal sign showing both sides are the same. Una oración matemática con un signo igual que muestra que ambos lados son iguales. |
x + 8 = 15 — exactly one answer: x = 7 | |
| Inequality Desigualdad |
A math sentence that compares two sides with <, >, ≤, or ≥. Una oración matemática que compara dos lados con <, >, ≤ o ≥. |
x + 5 > 12 — many answers: x = 8, 9, 10, ... | |
| Reasonableness Razonabilidad |
Checking if your answer makes sense. Revisar si tu respuesta tiene sentido. |
If the problem asks for a number of people and you get x = −3, that is NOT reasonable | |
| Variable Variable |
A letter that stands for a number that is unknown or can change. Una letra que representa un número desconocido o que puede cambiar. |
“5 less than a number is 12” becomes x − 5 = 12, where x is the variable. |
Which Word Fits?
Use an equation for one exact value and an ___ for a range.
Use It In a Sentence
Check for Understanding #3
Teacher: If >30% thumbs down, re-teach with a fresh example before moving on.
Turn & Talk — Launch
Before solving a word problem, how do you decide whether to model it with an equation or an inequality?
👂 Listen For
Students use signal words ('equals/total' for an equation; 'at least/at most/no more than' for an inequality) to choose the correct model.
Extend: How would the same situation change if 'spends exactly $50' became 'spends at most $50'? Justify which model fits each version.
EXPLORE & PRACTICE
⏱ ~18 min
Visual Modeling Workspace
Use the drawing tray below to annotate the visual model. Teacher: say "Click to reveal" on key steps.
Explore Activity
Read each word problem. Decide if it needs an equation or an inequality. Write the mathematical model, solve it, and check your answer for reasonableness.
✍️ Explore Discourse
How do you decide whether a word problem needs an equation or an inequality?
Whiteboard Moment
Show your work clearly. Be ready to explain your thinking to a partner.
Turn & Talk — Explore
What was your plan to solve this problem, and how did you check that your answer was reasonable?
👂 Listen For
Students describe modeling the situation, solving with inverse operations, and judging reasonableness by checking the answer fits the real context.
Extend: Suppose your solution is a negative number or a fraction that doesn't fit the situation. What should you do, and why does reasonableness matter?
Practice Check A
A student solved 4n = 52 and got n = 13. Is the answer reasonable if n represents the number of notebooks in a box?
✍️ Show Your Work
Explain why your answer is correct using today's vocabulary.
Practice Check B
A museum has some paintings. After adding 12, they have 45. Which equation models this?
✍️ Show Your Work
Explain why your answer is correct using today's vocabulary.
Equivalent Ratio Sort
Complete the interactive activity using today's strategy.
✍️ Justify Your Thinking
Room 1: The case board is a mess. Sort each clue into whether it needs an EQUATION (one exact total) or an INEQUALITY (a limit or range).
A classmate turned in the work below. One step has a mistake. Read every step, find it, name it, and fix it.
Choose ONE option to show what you know — then do it in the workspace below.
Use evidence from today's lesson to complete each frame.
Today's key idea is: "Modeling Real-World Scenarios with Equations & Inequalities. 1. Define the variable and units in the scenario. 2. Look for keywords: 'equals/is' (=) vs 'at least/limit' (≥, ≤, >, <). 3. Write the algebraic model, solve with inverse operations, and check in context" — and it works because ___.
Because Equations and Inequalities Problem Solving means ___, but a tricky part is ___, so I have to ___.
A common mistake with Equations and Inequalities Problem Solving is ___. It happens because ___, and the fix is ___.
I can prove my answer is correct by ___, using Model to check my work.
✍️ TWR · WRITE 3 SENTENCES · 7 MIN
Modeling Real-World Scenarios with Equations & Inequalities. 1. Define the variable and units in the scenario. 2. Look for keywords: 'equals/is' (=) vs 'at least/limit' (≥, ≤, >, <). 3. Write the algebraic model, solve with inverse operations, and check in context because ___
Modeling Real-World Scenarios with Equations & Inequalities. 1. Define the variable and units in the scenario. 2. Look for keywords: 'equals/is' (=) vs 'at least/limit' (≥, ≤, >, <). 3. Write the algebraic model, solve with inverse operations, and check in context but ___
Modeling Real-World Scenarios with Equations & Inequalities. 1. Define the variable and units in the scenario. 2. Look for keywords: 'equals/is' (=) vs 'at least/limit' (≥, ≤, >, <). 3. Write the algebraic model, solve with inverse operations, and check in context so ___
🌱 TWR · GROW THE KERNEL · 6 MIN
Answer these to add detail
Sentence starters (tap to use)
Student Workspace
Read each word problem. Decide if it needs an equation or an inequality. Write the mathematical model, solve it, and check your answer for reasonableness.
| Column A | Column B |
|---|---|
| [object Object] | |
| [object Object] | |
| [object Object] |
✏️ Sketch Your Strategy
Differentiation Paths
Step-by-step with a worked model and sentence frames.
A museum has some paintings. After adding 12, they have 45. Which equation models this?
Core practice aligned to the standard.
Extension with error analysis or multi-step reasoning.
Partner Activity
Work with your partner on the practice problems at your differentiation path level. Explain each step using math vocabulary.
Check for Understanding #4
Teacher: If >30% thumbs down, re-teach with a fresh example before moving on.
Real-World Connection
🌍 Math in the Wild
A detective has a $500 budget for equipment. She has already spent $320. The inequality 320 + r ≤ 500 represents the remaining amount r she can spend. She also needs exactly 4 flashlights at $15 each, represented by the equation 4f = 60.
✍️ Connection Reasoning
How much more can the detective spend? How much does each flashlight cost? When do you use an equation versus an inequality?
The detective can spend at most $__ more because r ≤ 500 − ___ = ___. Each flashlight costs $__ because f = 60 ÷ ___ = ___.
Turn & Talk — Connect
Describe a real situation that an equation or inequality could model, and explain which one you would use.
👂 Listen For
Students give a realistic context and correctly match it to an equation (exact value) or inequality (range/limit), justifying their choice.
Extend: Critique: 'Any word problem can be solved with an equation, so inequalities are never needed.' Use an example to argue why inequalities are sometimes the only correct model.
Summarize: Equations and Inequalities Problem Solving
Modeling Real-World Scenarios with Equations & Inequalities. 1. Define the variable and units in the scenario. 2. Look for keywords: 'equals/is' (=) vs 'at least/limit' (≥, ≤, >, <). 3. Write the algebraic model, solve with inverse operations, and check in context
In your own words:
CLOSURE & REFLECT
⏱ ~8 min
Today I learned that ___ because ___.
One thing I am still not sure about is ___.
A box of donuts has some donuts. After giving away 7, there are fewer than 5 left. Which inequality represents the starting number of donuts d?
Bonus Exit Check
A detective needs more than 8 hours to finish the investigation. She has already worked 3 hours. Which inequality represents the additional hours h she needs?
✍️ Show Your Work
Explain why your answer is correct using today's vocabulary.
Reflection & Self-Assessment
Continue Learning
Launch the Full Interactive Activity
Students continue practice in the HTML lesson engine with auto-check, hints, and differentiation.
Family Connection
Share tonight's family homework and discuss one vocabulary word at home.
Open Family Homework ↗Teacher Notes
⏱️ Pacing Guide
- Launch & vocab: 12 min
- I Do / We Do / You Do: 15 min
- Explore & practice: 15 min
- Connect & closure: 8 min
Total: ~45 min
🎯 Listen For · Common Errors
• Students use signal words ('equals/total' for an equation; 'at least/at most/no more than' for an inequality) to choose the correct model.
• Students describe modeling the situation, solving with inverse operations, and judging reasonableness by checking the answer fits the real context.
• Students give a realistic context and correctly match it to an equation (exact value) or inequality (range/limit), justifying their choice.
• Listen for students naming a specific strategy tied to 6.AT.8 — not just "I multiplied." They should connect steps to the key idea.
Common mistake: A common mistake in Equations and Inequalities Problem Solving is matching the wrong model to a key phrase. For 'the getaway car held no more than 6 bags,' students often write the equation b = 6 instead of the inequality b ≤ 6, because they see one number and assume it must be exact. The same mistake happens in reverse: for 'the reward split equally among 5 people gave each $40,' students sometimes write the inequality 5p ≥ 40 instead of the equation 5p = 40, because 'split equally' sounds like it could mean a range. Before you submit, ask: does this phrase give one exact value (equation, =) or a limit/range (inequality, <, >, ≤, ≥)?
Answer Key (Teacher Appendix)
Hide this slide during presentation or move to the end of your copy.
✓ Practice 1: Yes — 13 notebooks per box is reasonable — 4 × 13 = 52 ✓. 13 notebooks per box is a reasonable whole number answer.
✓ Practice 2: p + 12 = 45 — 'Adding 12' to the original number gives 45: p + 12 = 45. Solve: p = 33.
✓ Practice 3: 3 + h > 8 — 3 hours plus additional hours h must be more than 8: 3 + h > 8. Solve: h > 5.
✓ Practice 4: n / 6 = 7 — Divided by 6 is n / 6. Equals 7 means = 7. So n / 6 = 7.
✓ Exit ticket: d − 7 < 5 — Starting with d donuts and giving away 7 leaves fewer than 5: d − 7 < 5. Solve: d < 12. ✓