Touch and changeToca y cambia
Compare City A and City B. Their means match; use MAD to compare variability.Esta noche usamos la DMA — desviación media absoluta — para comparar dos grupos que tienen el MISMO promedio pero no se comportan igual.
Unit 2 · Understanding the World Around Us Through StatisticsUnidad 2 · Entender el mundo que nos rodea con la estadística
Map pinPunto en el mapa
Two cities both have an average high of 52 degrees. City A highs: 46, 50, 54, 58. City B highs: 36, 48, 56, 68. You pack one jacket. Which city is easier to pack for?Dos ciudades tienen una máxima promedio de 52 grados. Máximas de la ciudad A: 46, 50, 54, 58. Máximas de la ciudad B: 36, 48, 56, 68. Llevas una sola chamarra. ¿Para qué ciudad es más fácil empacar?
Five short steps, about 15–20 minutes: watch the idea, try one together, solve 10 in three levels, check, celebrate.Cinco pasos cortos, unos 15–20 minutos: miren la idea, prueben uno juntos, resuelvan 10 en tres niveles, revisen y celebren.
Optional. No grades, no account. Your place is saved on this device.Opcional. Sin calificaciones ni cuenta. Su avance se guarda en este dispositivo.
Tonight's ideaLa idea de hoy Use the MAD to compare two data sets that have the same mean.Usar la DMA para comparar dos conjuntos de datos que tienen la misma media.
💡 Draw fraction bars, tape diagrams, equations, or line up decimals together!💡 ¡Dibujen barras de fracciones, modelos o alineen decimales juntos!
Step 1 of 5Paso 1 de 5
Read the goal and look at the picture. Then go through the example one step at a time.Lean la meta y miren el dibujo. Luego sigan el ejemplo un paso a la vez.
Use the MAD to compare two data sets that have the same mean.
Usar la DMA para comparar dos conjuntos de datos que tienen la misma media.
In class we usedEn clase usamos comparing with the MADcomparar con la DMA.
Why it worksPor qué funciona The average tells the typical high. The MAD tells how far highs usually stray from it, so the same average can hide very different weeks.El promedio dice cuál es la máxima típica. La DMA dice qué tan lejos suelen quedar las máximas de ese promedio, así que el mismo promedio puede esconder semanas muy distintas.
Your case:Su caso: Tonight we use MAD — mean absolute deviation — to compare two groups that have the SAME average but do not behave the same at all.Esta noche usamos la DMA — desviación media absoluta — para comparar dos grupos que tienen el MISMO promedio pero no se comportan igual.
Tap a clue to read what it means.Toquen una pista para leer qué significa.
Look at the picture and the story. Say it out loud, or type a few words. There is no wrong answer here.Mira el dibujo y la historia. Dilo en voz alta o escribe unas palabras. Aquí no hay respuestas incorrectas.
Just for you. It stays on this device. We ask again at the end.Solo para ti. Se queda en este dispositivo. Preguntamos otra vez al final.
The mean is 20. How far is 13 from the mean?La media es 20. ¿A qué distancia de la media está 13?
Not yet. Try another look.Todavía no. Intenta otra mirada.
The distance is the bigger number minus the smaller: 20 − 13 = 7.La distancia es el número mayor menos el menor: 20 − 13 = 7.
What is the mean of 4, 8, 6, 10?¿Cuál es la media de 4, 8, 6, 10?
Not yet. Try another look.Todavía no. Intenta otra mirada.
Add: 4 + 8 + 6 + 10 = 28. Divide by 4 numbers: 28 ÷ 4 = 7.Suma: 4 + 8 + 6 + 10 = 28. Divide entre 4 números: 28 ÷ 4 = 7.
Step 2 of 5Paso 2 de 5
Do this one side by side. Use the model, and ask for a hint whenever you want one.Háganlo lado a lado. Usen el modelo y pidan una pista cuando quieran.
Try this one togetherPrueben este juntos
Team P scores: 15, 19, 23, 27. Team Q scores: 11, 17, 25, 31. Each team has a mean of 21.Puntajes del equipo P: 15, 19, 23, 27. Del equipo Q: 11, 17, 25, 31. Cada equipo tiene media de 21.
How far is each of Team P's scores from 21?¿Qué tan lejos está cada puntaje del equipo P de 21?
6, 2, 2, 6 — all positive distances.6, 2, 2, 6 — todas distancias positivas.
Subtract the smaller from the larger each time so every distance is positive.Resten el menor del mayor cada vez para que toda distancia sea positiva.
How far is each of Team Q's scores from 21?¿Qué tan lejos está cada puntaje del equipo Q de 21?
10, 4, 4, 10.10, 4, 4, 10.
The mean is the same for both teams, so you compare to 21 both times.La media es la misma para ambos equipos, así que comparan con 21 las dos veces.
Find each MAD. Which team is more consistent?Hallen cada DMA. ¿Qué equipo es más constante?
P: 16 ÷ 4 = 4. Q: 28 ÷ 4 = 7. Team P is more consistent.P: 16 ÷ 4 = 4. Q: 28 ÷ 4 = 7. El equipo P es más constante.
Smaller MAD means the scores hug the mean more closely.Una DMA menor significa que los puntajes se acercan más a la media.
Move a dot. See how far each dot is from the mean.Mueve un punto. Mira qué tan lejos está cada punto de la media.
Change one value. Watch what changes in the picture and answer.Cambia un valor. Mira qué cambia en el dibujo y la respuesta. Say: “When ___ changes, ___ changes.”Di: “Cuando ___ cambia, ___ cambia.”
Before you go on: say one thing the model showed you.Antes de seguir: digan una cosa que les mostró el modelo.
Compare City A and City B. Their means match; use MAD to compare variability.Esta noche usamos la DMA — desviación media absoluta — para comparar dos grupos que tienen el MISMO promedio pero no se comportan igual.
Compare City A and City B. Their means match; use MAD to compare variability.Esta noche usamos la DMA — desviación media absoluta — para comparar dos grupos que tienen el MISMO promedio pero no se comportan igual.
City A has a MAD of 4 and City B a MAD of 10, so City B's highs vary far more even though the averages match.La ciudad A tiene DMA de 4 y la B de 10, así que las máximas de B varían mucho más aunque los promedios coincidan.
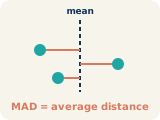
Two data sets can share a mean and still be completely different. MAD is the average distance of the values from the mean, so it measures that difference. A small MAD means the values huddle near the mean — consistent. A large MAD means they scatter far from it.Dos conjuntos de datos pueden compartir la media y aun así ser muy distintos. La DMA es la distancia promedio de los valores a la media, así que mide esa diferencia. Una DMA pequeña significa que los valores están cerca de la media — constantes. Una DMA grande significa que se alejan mucho.
Ask: "Where do you see the numbers from tonight's math in this model?"Pregunta: "¿Dónde ves los números de la tarea de hoy en este modelo?"
Use the MAD to compare two data sets that have the same mean.
Usar la DMA para comparar dos conjuntos de datos que tienen la misma media.
Both city means are 52 degrees.Las medias de ambas ciudades son 52 grados.
| CityCiudad | Distances from 52Distancias desde 52 | MADDAM |
|---|---|---|
| A | 6, 2, 2, 6 | 16 ÷ 4 = 4 |
| B | 16, 4, 4, 16 | 40 ÷ 4 = 10 |
Two data sets can share a mean and still be completely different. MAD is the average distance of the values from the mean, so it measures that difference. A small MAD means the values huddle near the mean — consistent. A large MAD means they scatter far from it.
Dos conjuntos de datos pueden compartir la media y aun así ser muy distintos. La DMA es la distancia promedio de los valores a la media, así que mide esa diferencia. Una DMA pequeña significa que los valores están cerca de la media — constantes. Una DMA grande significa que se alejan mucho.
Write the highs: City A 46, 50, 54, 58; City B 36, 48, 56, 68.
Escribe las máximas: ciudad A 46, 50, 54, 58; ciudad B 36, 48, 56, 68.
Both have mean 52.
Ambas tienen media de 52.
Measure every temperature's distance from 52.
Mide la distancia de cada temperatura a 52.
City A: 6, 2, 2, 6. City B: 16, 4, 4, 16.
Ciudad A: 6, 2, 2, 6. Ciudad B: 16, 4, 4, 16.
Average City A's distances: 6 + 2 + 2 + 6 = 16, and 16 ÷ 4 = 4.
Promedia las distancias de la ciudad A: 6 + 2 + 2 + 6 = 16, y 16 ÷ 4 = 4.
Its MAD is 4.
Su DMA es 4.
Average City B's distances: 16 + 4 + 4 + 16 = 40, and 40 ÷ 4 = 10.
Promedia las distancias de la ciudad B: 16 + 4 + 4 + 16 = 40, y 40 ÷ 4 = 10.
Its MAD is 10.
Su DMA es 10.
Compare: the means match, but City B's MAD of 10 is bigger, so its highs vary far more.
Compara: las medias coinciden, pero la DMA de la ciudad B, 10, es mayor, así que sus máximas varían mucho más.
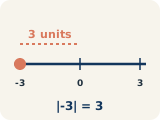
Listen for "deviation" (desviación) — how far one value sits from the mean. It is a distance, so it is never negative.
Escuchen "desviación" — qué tan lejos está un valor de la media. Es una distancia, así que nunca es negativa.
If the distances add up to 0, the signs were kept. Take the absolute value of each one FIRST, then add.
Si las distancias suman 0, se conservaron los signos. Tomen primero el valor absoluto de cada una, y luego sumen.
Ask where a small MAD matters in real life — a bus schedule, a medicine dose, a delivery time.
Pregunten dónde importa una DMA pequeña en la vida real — un horario de autobús, una dosis de medicina, una hora de entrega.
Step 3 of 5Paso 3 de 5
One at a time. Work on your own; a grown-up can watch.Uno a la vez. Trabaja solo; un adulto puede observar.
10 problems. Hints are always okay. 10 problemas. Las pistas siempre están bien.
+0 bonusextraIt averages distances from the mean.
Promedia distancias a la media.
What does MAD average?
¿Qué promedia la DMA?
A large MAD means the values are scattered far from the mean. So the answer is: Scattered far from the mean.
Una DMA grande significa que los valores están dispersos lejos de la media. Entonces la respuesta es: Dispersos lejos de la media.
A large MAD means the values are...Una DMA grande significa que los valores están...
Answer key for families — compare, then talk about why.Clave de respuestas para la familia — comparen y hablen del porqué.
Not tried yet? Close this and give it one try first. A wrong first try still helps.¿Todavía no lo intentaron? Ciérrenla y hagan un intento primero. Un primer intento equivocado también ayuda.
Why:Por qué: A large MAD means the values are scattered far from the mean. So the answer is: Scattered far from the mean.Una DMA grande significa que los valores están dispersos lejos de la media. Entonces la respuesta es: Dispersos lejos de la media.
Find four distances, add them, then divide by 4.
Halla cuatro distancias, súmalas y divide entre 4.
How far is each value from 10?
¿Qué tan lejos está cada valor de 10?
The distances are 3, 1, 1, 3. Their sum is 8 and 8 ÷ 4 = 2.
Las distancias son 3, 1, 1, 3. Su suma es 8 y 8 ÷ 4 = 2.
Set M is 7, 9, 11, 13 with mean 10. What is its MAD?El conjunto M es 7, 9, 11, 13 con media 10. ¿Cuál es su DMA?
Answer key for families — compare, then talk about why.Clave de respuestas para la familia — comparen y hablen del porqué.
Not tried yet? Close this and give it one try first. A wrong first try still helps.¿Todavía no lo intentaron? Ciérrenla y hagan un intento primero. Un primer intento equivocado también ayuda.
Why:Por qué: The distances are 3, 1, 1, 3. Their sum is 8 and 8 ÷ 4 = 2.Las distancias son 3, 1, 1, 3. Su suma es 8 y 8 ÷ 4 = 2.
Thinking two data sets with the same mean must behave the same. The MAD can be very different when the means match.
Pensar que dos conjuntos de datos con la misma media deben comportarse igual. La DMA puede ser muy distinta cuando las medias coinciden.
Plant ___ has MAD ___ and Plant ___ has MAD ___, so Plant ___ is more consistent.
La planta ___ tiene DMA ___ y la planta ___ tiene DMA ___, así que la planta ___ es más consistente.
Mia's gaps are 1, 0, 1 and 0, so her MAD is 2 ÷ 4 = 0.5. Leo's gaps are 4, 2, 2 and 4, so his MAD is 12 ÷ 4 = 3. A smaller MAD means more consistent.
Las distancias de Mia son 1, 0, 1 y 0, así que su DMA es 2 ÷ 4 = 0.5. Las de Leo son 4, 2, 2 y 4, así que su DMA es 12 ÷ 4 = 3. Una DMA menor significa más constante.
Mia's quiz scores are 8, 9, 10, 9. Leo's are 5, 7, 11, 13. Both means are 9. Who is more consistent?Los puntajes de Mia son 8, 9, 10, 9. Los de Leo son 5, 7, 11, 13. Las dos medias son 9. ¿Quién es más constante?
Answer key for families — compare, then talk about why.Clave de respuestas para la familia — comparen y hablen del porqué.
Not tried yet? Close this and give it one try first. A wrong first try still helps.¿Todavía no lo intentaron? Ciérrenla y hagan un intento primero. Un primer intento equivocado también ayuda.
Why:Por qué: Mia's gaps are 1, 0, 1 and 0, so her MAD is 2 ÷ 4 = 0.5. Leo's gaps are 4, 2, 2 and 4, so his MAD is 12 ÷ 4 = 3. A smaller MAD means more consistent.Las distancias de Mia son 1, 0, 1 y 0, así que su DMA es 2 ÷ 4 = 0.5. Las de Leo son 4, 2, 2 y 4, así que su DMA es 12 ÷ 4 = 3. Una DMA menor significa más constante.
Compare the distances, not the means.
Compara las distancias, no las medias.
How far are the values of each set from 10?
¿Qué tan lejos están de 10 los valores de cada conjunto?
Set B's values are 9 away from 10, while Set A's are 1 away, so Set B is more spread out than Set A, even with the same mean.
Los valores de B están a 9 de 10 y los de A a 1, así que el conjunto B está más disperso que el A, aunque tienen la misma media.
Set A is 9, 10, 11. Set B is 1, 10, 19. Both have mean 10. Which statement is true?El conjunto A es 9, 10, 11. El conjunto B es 1, 10, 19. Los dos tienen media 10. ¿Qué enunciado es verdadero?
Answer key for families — compare, then talk about why.Clave de respuestas para la familia — comparen y hablen del porqué.
Not tried yet? Close this and give it one try first. A wrong first try still helps.¿Todavía no lo intentaron? Ciérrenla y hagan un intento primero. Un primer intento equivocado también ayuda.
Why:Por qué: Set B's values are 9 away from 10, while Set A's are 1 away, so Set B is more spread out than Set A, even with the same mean.Los valores de B están a 9 de 10 y los de A a 1, así que el conjunto B está más disperso que el A, aunque tienen la misma media.
How far is each number from the mean of 10?
¿A qué distancia está cada número de la media, 10?
How far is 4 from 10? How far is 16?
¿Qué tan lejos está 4 de 10? ¿Y 16?
The distances are 6, 2, 2, 6. Their sum is 16 and 16 ÷ 4 = 4.
Las distancias son 6, 2, 2, 6. Su suma es 16 y 16 ÷ 4 = 4.
Set N is 4, 8, 12, 16 with mean 10. What is its MAD?El conjunto N es 4, 8, 12, 16 con media 10. ¿Cuál es su DMA?
Answer key for families — compare, then talk about why.Clave de respuestas para la familia — comparen y hablen del porqué.
Not tried yet? Close this and give it one try first. A wrong first try still helps.¿Todavía no lo intentaron? Ciérrenla y hagan un intento primero. Un primer intento equivocado también ayuda.
Why:Por qué: The distances are 6, 2, 2, 6. Their sum is 16 and 16 ÷ 4 = 4.Las distancias son 6, 2, 2, 6. Su suma es 16 y 16 ÷ 4 = 4.
Greater MAD means values farther from the mean.
DMA mayor significa valores más lejos de la media.
Which MAD is greater, 2 or 4?
¿Cuál DMA es mayor, 2 o 4?
A larger MAD means more variation, so Set N varies more because its MAD is larger.
Una DMA mayor significa más variación, así que el conjunto N varía más porque su DMA es mayor.
Set M has MAD 2 and Set N has MAD 4, and both have mean 10. Which statement is true?El conjunto M tiene DMA 2 y el conjunto N tiene DMA 4, y los dos tienen media 10. ¿Qué enunciado es verdadero?
Answer key for families — compare, then talk about why.Clave de respuestas para la familia — comparen y hablen del porqué.
Not tried yet? Close this and give it one try first. A wrong first try still helps.¿Todavía no lo intentaron? Ciérrenla y hagan un intento primero. Un primer intento equivocado también ayuda.
Why:Por qué: A larger MAD means more variation, so Set N varies more because its MAD is larger.Una DMA mayor significa más variación, así que el conjunto N varía más porque su DMA es mayor.
Smaller MAD means the times stay near the average.
DMA menor significa que los tiempos se quedan cerca del promedio.
Which MAD is smaller?
¿Cuál DMA es menor?
Route 1 has the smaller MAD, so its times stay closer to 20 minutes: Route 1.
La ruta 1 tiene la DMA menor, así que sus tiempos se quedan más cerca de 20 minutos: la ruta 1.
Two bus routes both average 20 minutes. Route 1 has MAD 1 and Route 2 has MAD 6. Which route has more predictable trip times?Dos rutas de autobús tienen un promedio de 20 minutos. La ruta 1 tiene DMA 1 y la ruta 2 tiene DMA 6. ¿Qué ruta tiene tiempos de viaje más predecibles?
Answer key for families — compare, then talk about why.Clave de respuestas para la familia — comparen y hablen del porqué.
Not tried yet? Close this and give it one try first. A wrong first try still helps.¿Todavía no lo intentaron? Ciérrenla y hagan un intento primero. Un primer intento equivocado también ayuda.
Why:Por qué: Route 1 has the smaller MAD, so its times stay closer to 20 minutes: Route 1.La ruta 1 tiene la DMA menor, así que sus tiempos se quedan más cerca de 20 minutos: la ruta 1.
Easier problems to practice the idea. Do these first together. Problemas más fáciles para practicar la idea. Hagan estos primero juntos.
Think of 74, 75, 76 versus 55, 75, 95 — both have mean 75.
Piensa en 74, 75, 76 contra 55, 75, 95 — los dos tienen media 75.
Mean is the center. MAD is the spread. They are two different questions.
La media es el centro. La MAD es la dispersión. Son dos preguntas distintas.
Two sets can share a mean and have completely different spreads — 74, 75, 76 and 55, 75, 95 both average 75, but the second scatters far more. That is why MAD exists. The mean is not the spread, and it does not determine the MAD.
Dos conjuntos pueden compartir la media y tener dispersiones completamente distintas — 74, 75, 76 y 55, 75, 95 promedian 75, pero el segundo se dispersa mucho más. Para eso existe la MAD. La media no es la dispersión, y no determina la MAD.
Both teams have the same mean score of 75. Does that mean their scores are equally spread out?Los dos equipos tienen la misma media de 75. ¿Eso significa que sus puntajes están igual de dispersos?
Answer key for families — compare, then talk about why.Clave de respuestas para la familia — comparen y hablen del porqué.
Not tried yet? Close this and give it one try first. A wrong first try still helps.¿Todavía no lo intentaron? Ciérrenla y hagan un intento primero. Un primer intento equivocado también ayuda.
Why:Por qué: Two sets can share a mean and have completely different spreads — 74, 75, 76 and 55, 75, 95 both average 75, but the second scatters far more. That is why MAD exists. The mean is not the spread, and it does not determine the MAD.Dos conjuntos pueden compartir la media y tener dispersiones completamente distintas — 74, 75, 76 y 55, 75, 95 promedian 75, pero el segundo se dispersa mucho más. Para eso existe la MAD. La media no es la dispersión, y no determina la MAD.
A small average distance means the values huddle near the mean.
Una distancia promedio pequeña significa que los valores se agrupan cerca de la media.
MAD is the AVERAGE DISTANCE of the values from the mean.
La MAD es la DISTANCIA PROMEDIO de los valores a la media.
A MAD of 2 means Team X's scores are, on average, only 2 points from their mean — consistent. A MAD says nothing about how GOOD the scores are, and consistency can be compared from the MADs alone.
Una MAD de 2 significa que los puntajes del Equipo X están, en promedio, a solo 2 puntos de su media — consistentes. Una MAD no dice nada de qué tan BUENOS son los puntajes, y la consistencia se puede comparar solo con las MAD.
Team X has a MAD of 2 points and Team Y has a MAD of 9 points. Whose scores are more consistent?El Equipo X tiene una MAD de 2 puntos y el Equipo Y tiene una MAD de 9 puntos. ¿Los puntajes de quién son más consistentes?
Answer key for families — compare, then talk about why.Clave de respuestas para la familia — comparen y hablen del porqué.
Not tried yet? Close this and give it one try first. A wrong first try still helps.¿Todavía no lo intentaron? Ciérrenla y hagan un intento primero. Un primer intento equivocado también ayuda.
Why:Por qué: A MAD of 2 means Team X's scores are, on average, only 2 points from their mean — consistent. A MAD says nothing about how GOOD the scores are, and consistency can be compared from the MADs alone.Una MAD de 2 significa que los puntajes del Equipo X están, en promedio, a solo 2 puntos de su media — consistentes. Una MAD no dice nada de qué tan BUENOS son los puntajes, y la consistencia se puede comparar solo con las MAD.
Average each list.
Promedia cada lista.
P's distances from 21: 6, 2, 2, 6. Q's: 10, 4, 4, 10.
Distancias de P a 21: 6, 2, 2, 6. Las de Q: 10, 4, 4, 10.
P: (6 + 2 + 2 + 6) ÷ 4 = 4. Q: (10 + 4 + 4 + 10) ÷ 4 = 7. Team P is more consistent. Sharing a mean does not make the spreads equal — that is exactly what MAD reveals — and 21 is the mean, not a MAD.
P: (6 + 2 + 2 + 6) ÷ 4 = 4. Q: (10 + 4 + 4 + 10) ÷ 4 = 7. El Equipo P es más consistente. Compartir la media no iguala las dispersiones — eso es justo lo que revela la MAD — y 21 es la media, no una MAD.
Team P scores: 15, 19, 23, 27. Team Q scores: 11, 17, 25, 31. Both have a mean of 21. Which team is more consistent, and what are the MADs?Puntajes del Equipo P: 15, 19, 23, 27. Puntajes del Equipo Q: 11, 17, 25, 31. Los dos tienen media 21. ¿Qué equipo es más consistente, y cuáles son las MAD?
Answer key for families — compare, then talk about why.Clave de respuestas para la familia — comparen y hablen del porqué.
Not tried yet? Close this and give it one try first. A wrong first try still helps.¿Todavía no lo intentaron? Ciérrenla y hagan un intento primero. Un primer intento equivocado también ayuda.
Why:Por qué: P: (6 + 2 + 2 + 6) ÷ 4 = 4. Q: (10 + 4 + 4 + 10) ÷ 4 = 7. Team P is more consistent. Sharing a mean does not make the spreads equal — that is exactly what MAD reveals — and 21 is the mean, not a MAD.P: (6 + 2 + 2 + 6) ÷ 4 = 4. Q: (10 + 4 + 4 + 10) ÷ 4 = 7. El Equipo P es más consistente. Compartir la media no iguala las dispersiones — eso es justo lo que revela la MAD — y 21 es la media, no una MAD.
Try these once the warm-up feels easy. It's okay to use the steps and pictures. Intenten estos cuando el calentamiento sea fácil. Está bien usar los pasos y los dibujos.
Shop A's distances: 2, 1, 0, 1, 2. Shop B's: 15, 10, 0, 10, 15.
Distancias de la Pizzería A: 2, 1, 0, 1, 2. Las de B: 15, 10, 0, 10, 15.
Find each value's distance from 30, then average the five distances.
Halla la distancia de cada valor a 30, y luego promedia las cinco distancias.
Shop A: distances 2, 1, 0, 1, 2 → MAD = 6 ÷ 5 = 1.2 minutes. Shop B: distances 15, 10, 0, 10, 15 → MAD = 50 ÷ 5 = 10 minutes. Both average 30. In these five deliveries, every Shop A time is within 2 minutes of 30; Shop B includes times of 15 and 45 minutes. The smaller MAD describes less variation in the observed times. It does not guarantee a future delivery time.
Pizzería A: distancias 2, 1, 0, 1, 2 → MAD = 6 ÷ 5 = 1.2 minutos. Pizzería B: distancias 15, 10, 0, 10, 15 → MAD = 50 ÷ 5 = 10 minutos. Las dos promedian 30. En estas cinco entregas, todos los tiempos de la Pizzería A están a no más de 2 minutos de 30; la Pizzería B incluye tiempos de 15 y 45 minutos. La MAD menor describe menos variación en los tiempos observados. No garantiza el tiempo de una entrega futura.
Two pizza shops advertise the same mean delivery time of 30 minutes. Shop A's last five deliveries took 28, 29, 30, 31, 32 minutes. Shop B's took 15, 20, 30, 40, 45 minutes. Find each shop's MAD, say which shop you would order from, and give a real-world reason why a SMALL MAD matters here.Dos pizzerías anuncian la misma media de entrega de 30 minutos. Las últimas cinco entregas de la Pizzería A tardaron 28, 29, 30, 31, 32 minutos. Las de la Pizzería B tardaron 15, 20, 30, 40, 45 minutos. Halla la MAD de cada pizzería, di de cuál pedirías y da una razón real por la que una MAD PEQUEÑA importa aquí.
Answer key for families — compare, then talk about why.Clave de respuestas para la familia — comparen y hablen del porqué.
Not tried yet? Close this and give it one try first. A wrong first try still helps.¿Todavía no lo intentaron? Ciérrenla y hagan un intento primero. Un primer intento equivocado también ayuda.
Sample answer:Respuesta de ejemplo: Shop A: distances 2, 1, 0, 1, 2 → MAD = 6 ÷ 5 = 1.2 minutes. Shop B: distances 15, 10, 0, 10, 15 → MAD = 50 ÷ 5 = 10 minutes. Both average 30. In these five deliveries, every Shop A time is within 2 minutes of 30; Shop B includes times of 15 and 45 minutes. The smaller MAD describes less variation in the observed times. It does not guarantee a future delivery time.Pizzería A: distancias 2, 1, 0, 1, 2 → MAD = 6 ÷ 5 = 1.2 minutos. Pizzería B: distancias 15, 10, 0, 10, 15 → MAD = 50 ÷ 5 = 10 minutos. Las dos promedian 30. En estas cinco entregas, todos los tiempos de la Pizzería A están a no más de 2 minutos de 30; la Pizzería B incluye tiempos de 15 y 45 minutos. La MAD menor describe menos variación en los tiempos observados. No garantiza el tiempo de una entrega futura.
A: (6 + 2 + 2 + 6) ÷ 4. B: (16 + 4 + 4 + 16) ÷ 4.
A: (6 + 2 + 2 + 6) ÷ 4. B: (16 + 4 + 4 + 16) ÷ 4.
MAD = the average of the distances.
MAD = el promedio de las distancias.
City A: (6 + 2 + 2 + 6) ÷ 4 = 16 ÷ 4 = 4. City B: (16 + 4 + 4 + 16) ÷ 4 = 40 ÷ 4 = 10. 16 and 40 are the totals before dividing; 6 and 16 are the largest single distances; 2 and 4 the smallest.
Ciudad A: (6 + 2 + 2 + 6) ÷ 4 = 16 ÷ 4 = 4. Ciudad B: (16 + 4 + 4 + 16) ÷ 4 = 40 ÷ 4 = 10. 16 y 40 son los totales antes de dividir; 6 y 16 son las distancias más grandes; 2 y 4 las más pequeñas.
City A's distances from the mean are 6, 2, 2, 6. City B's are 16, 4, 4, 16. What are the two MADs?Las distancias de la Ciudad A a la media son 6, 2, 2, 6. Las de la Ciudad B son 16, 4, 4, 16. ¿Cuáles son las dos MAD?
Answer key for families — compare, then talk about why.Clave de respuestas para la familia — comparen y hablen del porqué.
Not tried yet? Close this and give it one try first. A wrong first try still helps.¿Todavía no lo intentaron? Ciérrenla y hagan un intento primero. Un primer intento equivocado también ayuda.
Why:Por qué: City A: (6 + 2 + 2 + 6) ÷ 4 = 16 ÷ 4 = 4. City B: (16 + 4 + 4 + 16) ÷ 4 = 40 ÷ 4 = 10. 16 and 40 are the totals before dividing; 6 and 16 are the largest single distances; 2 and 4 the smallest.Ciudad A: (6 + 2 + 2 + 6) ÷ 4 = 16 ÷ 4 = 4. Ciudad B: (16 + 4 + 4 + 16) ÷ 4 = 40 ÷ 4 = 10. 16 y 40 son los totales antes de dividir; 6 y 16 son las distancias más grandes; 2 y 4 las más pequeñas.
52 − 46 = 6, 52 − 50 = 2, 54 − 52 = 2, 58 − 52 = 6.
52 − 46 = 6, 52 − 50 = 2, 54 − 52 = 2, 58 − 52 = 6.
Distance is how far each value is from 52, ignoring direction.
La distancia es qué tan lejos está cada valor de 52, sin importar la dirección.
The distances from 52 are 6, 2, 2 and 6 — nonnegative, because a distance cannot be negative. A value equal to the mean would have distance 0. Signed differences (−6, −2, 2, 6) would average to zero and hide the spread; the values themselves are not distances; 4 is the gap between neighbours, not the distance to the mean.
Las distancias a 52 son 6, 2, 2 y 6 — no negativas, porque una distancia no puede ser negativa. Un valor igual a la media tendría una distancia de 0. Las diferencias con signo (−6, −2, 2, 6) promediarían cero y esconderían la dispersión; los valores mismos no son distancias; 4 es la separación entre vecinos, no la distancia a la media.
City A's highs were 46, 50, 54 and 58, with a mean of 52. What are the four distances from the mean?Las máximas de la Ciudad A fueron 46, 50, 54 y 58, con una media de 52. ¿Cuáles son las cuatro distancias a la media?
Answer key for families — compare, then talk about why.Clave de respuestas para la familia — comparen y hablen del porqué.
Not tried yet? Close this and give it one try first. A wrong first try still helps.¿Todavía no lo intentaron? Ciérrenla y hagan un intento primero. Un primer intento equivocado también ayuda.
Why:Por qué: The distances from 52 are 6, 2, 2 and 6 — nonnegative, because a distance cannot be negative. A value equal to the mean would have distance 0. Signed differences (−6, −2, 2, 6) would average to zero and hide the spread; the values themselves are not distances; 4 is the gap between neighbours, not the distance to the mean.Las distancias a 52 son 6, 2, 2 y 6 — no negativas, porque una distancia no puede ser negativa. Un valor igual a la media tendría una distancia de 0. Las diferencias con signo (−6, −2, 2, 6) promediarían cero y esconderían la dispersión; los valores mismos no son distancias; 4 es la separación entre vecinos, no la distancia a la media.
Step 4 of 5Paso 4 de 5
See what each answer shows. Fix one, then try a fresh one.Vean qué muestra cada respuesta. Corrijan una y prueben una nueva.
Finish Your Turn first. Then this page shows what each answer tells us.Primero terminen Tu turno. Luego esta página muestra qué nos dice cada respuesta.
Step 5 of 5Paso 5 de 5
Celebrate what you did, see what it showed, then take one next step or stop here.Celebren lo que hicieron, vean lo que mostró y den un siguiente paso o paren aquí.
Saved only on this device. Your teacher has not received it.Se guarda solo en este dispositivo. Su maestro o maestra no lo ha recibido.
The last stepEl último paso
Compare it with how you felt at the start.Compáralo con cómo te sentías al empezar.
Weekends never break it. Saved only on this device.Los fines de semana no la interrumpen. Se guarda solo en este dispositivo.
Name one strategy that helped, or one question to ask next time. You can stop here; no adult signature is needed.
Di una estrategia que te ayudó o una pregunta para la próxima vez. Puedes terminar aquí; no necesitas la firma de un adulto.
Answers save automatically on this device. Tap Check This Problem anytime. Las respuestas se guardan solas en este dispositivo. Toquen Revisar esta pregunta cuando quieran.
These extras are not required. Photos, recordings and reflections stay on this device. To send anything to Mr. Neft, use ClassDojo.Estos extras no son obligatorios. Las fotos, grabaciones y reflexiones quedan en este dispositivo. Para enviar algo al Sr. Neft, usa ClassDojo.
Saved on:Guardado el:
🔥 1-Night StreakRacha de 1 noche
Question draft (not sent):Borrador de pregunta (no enviado):
Family reflection:Reflexión familiar:
Student Work Photo:Foto del trabajo:
Student Voice Memo:Nota de voz del estudiante:
A personal record of practice for . Saved on this device; not submitted to the teacher.
Practice partner (optional)
Date
Ask at the table
The means match. How does the MAD show the difference?
Try it together
Plant A grew 18, 20, 22, 24 cm and Plant B grew 12, 18, 24, 30 cm. Both means are 21. Find each value's distance from 21, then average the distances for each plant. Say which plant grew more consistently.
To start talking
Plant ___ has MAD ___ and Plant ___ has MAD ___, so Plant ___ is more consistent.
Pregunten en la mesa
Las medias coinciden. ¿Cómo muestra la DMA la diferencia?
Prueben juntos
La planta A creció 18, 20, 22, 24 cm y la planta B creció 12, 18, 24, 30 cm. Las dos medias son 21. Hallen la distancia de cada valor a 21 y luego promedien las distancias de cada planta. Digan qué planta creció con más constancia.
Para empezar a hablar
La planta ___ tiene DMA ___ y la planta ___ tiene DMA ___, así que la planta ___ es más consistente.
The means match. How does the MAD show the difference?Las medias coinciden. ¿Cómo muestra la DMA la diferencia?
Start your answer like this:Empiecen su respuesta así: Plant ___ has MAD ___ and Plant ___ has MAD ___, so Plant ___ is more consistent.La planta ___ tiene DMA ___ y la planta ___ tiene DMA ___, así que la planta ___ es más consistente.
A strong answer sounds like:Una respuesta sólida suena así: In class we also find each city's MAD: City A is 4 degrees and City B is 10 degrees, even though both means are 52.En clase también hallamos la DMA de cada ciudad: la ciudad A tiene 4 grados y la ciudad B tiene 10 grados, aunque las dos medias son 52.
No grown-up nearby? Say your answer out loud to yourself, then write one sentence that proves it. Either language is fine.¿No hay un adulto cerca? Di tu respuesta en voz alta y escribe una oración que la pruebe. Sirve cualquiera de los dos idiomas.
Thinking two data sets with the same mean must behave the same. The MAD can be very different when the means match. Pensar que dos conjuntos de datos con la misma media deben comportarse igual. La DMA puede ser muy distinta cuando las medias coinciden.
A different situation: Two cooks both average 30 minutes per dish. Cook X took 28, 30, 30, 32. Cook Y took 20, 28, 32, 40. Which cook is more consistent?Otra situación: Dos cocineros tardan en promedio 30 minutos por platillo. El cocinero X tardó 28, 30, 30, 32. El cocinero Y tardó 20, 28, 32, 40. ¿Quién es más constante?
Tap the step where the thinking went off track. Then explain why.Toca el paso donde el razonamiento se desvió. Luego explica por qué.
Not yet. Try another look.Todavía no. Intenta otra mirada.
How to fix it:Cómo corregirlo: A bigger MAD means more scatter. Cook X has the smaller MAD, 1, so Cook X is more consistent.Una DMA mayor significa más dispersión. El cocinero X tiene la DMA menor, 1, así que el cocinero X es más constante.
Say it out loud:Dilo en voz alta: The smaller MAD is ___, so the more consistent one is ___.La DMA menor es ___, así que el más constante es ___.
Two cities can have the same average temperature while one stays mild and the other swings from hot to cold. The MAD shows how much the temperatures move around the average. Dos ciudades pueden tener la misma temperatura promedio mientras una se mantiene templada y la otra oscila entre calor y frío. La DMA muestra cuánto se mueven las temperaturas alrededor del promedio.
Try it at homePruébenlo en casa
Plant A grew 18, 20, 22, 24 cm and Plant B grew 12, 18, 24, 30 cm. Both means are 21. Find each value's distance from 21, then average the distances for each plant. Say which plant grew more consistently.La planta A creció 18, 20, 22, 24 cm y la planta B creció 12, 18, 24, 30 cm. Las dos medias son 21. Hallen la distancia de cada valor a 21 y luego promedien las distancias de cada planta. Digan qué planta creció con más constancia.
Tonight's mystery challengeEl reto misterioso de hoy
City A's highs were 46, 50, 54 and 58, with a mean of 52. What are the four distances from the mean?Las máximas de la Ciudad A fueron 46, 50, 54 y 58, con una media de 52. ¿Cuáles son las cuatro distancias a la media?
Locked. Finish 10 problems and it opens. Bloqueado. Termina 10 problemas y se abre.
1. Tap a card to flip it. 2. Play the quiz. 3. Match the words. 1. Toca una tarjeta para voltearla. 2. Haz la prueba. 3. Empareja las palabras.
Desviación media absoluta
Desviación media absoluta
The typical distance of the data from the mean.
ES La distancia típica de los datos a la media.
Desviación
Desviación
How far a number is from the mean.
ES Qué tan lejos está un número de la media.
Valor absoluto
Valor absoluto
How far a number is from zero.
ES Qué tan lejos está un número del cero.
Media
Media
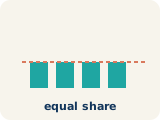
Add all the numbers, then divide by how many.
ES Suma todos los números y divide entre cuántos hay.
Variabilidad
Variabilidad
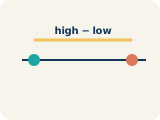
How far apart the numbers are.
ES Qué tan separados están los números.
Which word fits?¿Qué palabra encaja?
🎉 Quiz done!¡Prueba terminada!
First-try stars:Estrellas al primer intento:
Tap a word on the left, then tap its matching definition on the right! ¡Toca una palabra a la izquierda y su significado a la derecha!
Pick a game and play as a team. Nothing here is timed, and every game can be replayed as many times as you like. Escojan un juego y jueguen en equipo. Nada aquí tiene cronómetro, y pueden repetir cada juego cuantas veces quieran.
Try the recommended mission. Student: explain; partner: ask one question, then switch. Paper drawings work for every object. Prueba la misión recomendada. Estudiante: explica; acompañante: haz una pregunta, luego cambien. Puedes dibujar los objetos en papel.
One mission is enough. You can also work solo and explain in writing.Una misión es suficiente. También puedes trabajar a solas y explicar por escrito.
Plant A grew 18, 20, 22, 24 cm and Plant B grew 12, 18, 24, 30 cm. Both means are 21. Find each value's distance from 21, then average the distances for each plant. Say which plant grew more consistently.
La planta A creció 18, 20, 22, 24 cm y la planta B creció 12, 18, 24, 30 cm. Las dos medias son 21. Hallen la distancia de cada valor a 21 y luego promedien las distancias de cada planta. Digan qué planta creció con más constancia.
Show a labeled drawing, table, or equation. Your partner asks one question; working alone, write your explanation.
Muestra un dibujo con etiquetas, una tabla o una ecuación. Tu acompañante hace una pregunta; a solas, escribe tu explicación.
Choose ONE game. Quick Quiz practices this lesson; the other games review related skills. Play together or solo, without a timer. Elige UN juego. Reto rápido practica esta lección; los demás repasan temas relacionados. Juega acompañado o a solas, sin cronómetro.
Build a chain. The left side of each domino is the match for the problem on the end of the chain. Tap the domino that fits next. Armen una cadena. El lado izquierdo de cada ficha es la pareja del problema al final de la cadena. Toquen la ficha que encaja.
A student and a grown-up share one chain. Take turns placing, and switch coach and player each time. There is no winner and no timer.Un estudiante y un adulto comparten una cadena. Colocan fichas por turnos y cambian de entrenador y jugador cada vez. No hay ganador ni cronómetro.
🎉 Chain complete! The last problem links back to the first domino: a perfect loop.¡Cadena completa! El último problema conecta con la primera ficha: un círculo perfecto.
Take turns — student answers one, then a family member answers the next. Watch for the trick statements! Por turnos: el estudiante responde una y luego un familiar responde la siguiente. ¡Cuidado con las trampas!
Tap a card, then tap the bin it belongs in. Talk it through before you tap! Toquen una tarjeta y luego el cesto al que pertenece. ¡Conversen antes de tocar!
Everyone votes and says WHY. Then tap to see what the math says — sometimes it is a tie! Todos votan y dicen POR QUÉ. Luego toquen para ver qué dicen las matemáticas: ¡a veces es empate!
🔎 What the math saysLo que dicen las matemáticas
Reinforce tonight's topic with a quick family game. You ask; your student decides! Refuercen el tema de hoy con un juego rápido en familia. ¡Ustedes preguntan; su estudiante decide!
🎮 Play together! Statistical questions expect many different answers from a group. 🎮 ¡Jueguen juntos! Las preguntas estadísticas esperan muchas respuestas diferentes de un grupo.
The bigger review game for tonight's lesson — sort, match and choose. A wrong answer gives a hint and lets your student try again. No timer. El juego de repaso más grande para la lección de hoy — clasificar, emparejar y elegir. Si se equivocan, reciben una pista y lo intentan otra vez. Sin cronómetro.
Use this as a photobooth for the work itself: point the camera at tonight's notebook page, the scratchpad or the whiteboard and take the picture — or pose holding it up. Choose a frame, add stickers, then download it, print it, or add it to your optional reflection. The photo is never uploaded; it stays on this device. Úsenla como cabina de fotos del trabajo: apunten la cámara a la página del cuaderno, al borrador o a la pizarra y tomen la foto, o posen sosteniéndola. Elijan un marco, agreguen calcomanías y luego descárguenla, imprímanla o agréguenla a la reflexión opcional. La foto nunca se sube a internet; se queda en este dispositivo.
Camera Ready!¡Cámara lista!
Tap “Start Camera” to photograph tonight’s work, or use “Upload Work” below. The photo stays on this device.Toca “Iniciar Cámara” para fotografiar el trabajo de hoy, o usa “Subir Foto”. La foto se queda en este dispositivo.
Holding your open notebook or paper up next to your smile makes the best shot! You can also snap a photo of just your written work. ¡Sostener el cuaderno abierto junto a su sonrisa crea la mejor foto! También pueden tomar la foto solo de su trabajo escrito.
How far is this value from the mean? Distances cannot be negative. A value equal to the mean has distance 0.
¿Qué tan lejos está este valor de la media? Las distancias no pueden ser negativas. Un valor igual a la media tiene una distancia de 0.
Did you average the distances, or the original values?
¿Promediaste las distancias, o los valores originales?
Same mean — does that mean the two sets look the same?
Misma media — ¿eso significa que los dos conjuntos se ven iguales?
Add the deviations with their minus signs, they will work out.
Suma las desviaciones con sus signos negativos, ya se acomodarán.
If the means match, the data sets match.
Si las medias coinciden, los conjuntos de datos coinciden.
A MAD of 0 just means you did it fast.
Una DMA de 0 solo significa que lo hiciste rápido.
These links go to specific videos about tonight's topic — not general math pages. Estos enlaces van a videos específicos sobre el tema de hoy — no a páginas generales.
Family Math Studio
Lesson 2.9 · Session 26.DS.6c
Describe Data by Mean Absolute Deviation
Use the MAD to compare two data sets that have the same mean.
NameDate
Tonight's spark
Two cities both have an average high of 52 degrees. City A highs: 46, 50, 54, 58. City B highs: 36, 48, 56, 68. You pack one jacket. Which city is easier to pack for?
Guess first: which city has highs that stay closer to 52?
Try it
Work it out on paper. Write one answer on each line.
A large MAD means the values are...
My answer
Set A is 9, 10, 11. Set B is 1, 10, 19. Both have mean 10. Which statement is true?
My answer
Set M is 7, 9, 11, 13 with mean 10. What is its MAD?
My answer
Set N is 4, 8, 12, 16 with mean 10. What is its MAD?
My answer
Set M has MAD 2 and Set N has MAD 4, and both have mean 10. Which statement is true?
My answer
Talk about it
The means match. How does the MAD show the difference?
Home mission
Two bus routes both average 20 minutes. Route 1 takes 19, 20, 20, 21. Route 2 takes 10, 15, 25, 30. Ask your student which route they want on a school morning, and why.
If we get stuck, ask
Family Math Studio
Lección 2.9 · Sesión 26.DS.6c
Comparar conjuntos de datos con la DAM
Usar la DMA para comparar dos conjuntos de datos que tienen la misma media.
NombreFecha
La chispa de hoy
Dos ciudades tienen una máxima promedio de 52 grados. Máximas de la ciudad A: 46, 50, 54, 58. Máximas de la ciudad B: 36, 48, 56, 68. Llevas una sola chamarra. ¿Para qué ciudad es más fácil empacar?
Primero adivina: ¿qué ciudad tiene máximas más cercanas a 52?
Inténtalo
Resuélvelo en papel. Escribe una respuesta en cada línea.
Una DMA grande significa que los valores están...
Mi respuesta
El conjunto A es 9, 10, 11. El conjunto B es 1, 10, 19. Los dos tienen media 10. ¿Qué enunciado es verdadero?
Mi respuesta
El conjunto M es 7, 9, 11, 13 con media 10. ¿Cuál es su DMA?
Mi respuesta
El conjunto N es 4, 8, 12, 16 con media 10. ¿Cuál es su DMA?
Mi respuesta
El conjunto M tiene DMA 2 y el conjunto N tiene DMA 4, y los dos tienen media 10. ¿Qué enunciado es verdadero?
Mi respuesta
Conversen
Las medias coinciden. ¿Cómo muestra la DMA la diferencia?
Misión en casa
Dos rutas de autobús tienen un promedio de 20 minutos. La ruta 1 tarda 19, 20, 20, 21. La ruta 2 tarda 10, 15, 25, 30. Pregunten a su estudiante qué ruta querría en una mañana de escuela, y por qué.
Si se atoran, pregunten