Understand Inequalities and Their Solutions
I can graph the solutions of an inequality on a number line.
How to Use This Deck
Click Present or press F11 for fullscreen. Use arrow keys to advance.
Blue boxes show exactly what to say, ask, and how long to spend.
Text boxes, polls, and drag-sort save automatically in the browser.
Press N or click 📝 in the toolbar for pacing tips and answers.
Launch the full HTML activity for independent practice.
File → Print or the print button for handout copies.
🎯 Content Objective / Objetivo de contenido
I can graph the solutions of an inequality on a number line.
Today's Flow
Total pacing: ~45 min · Progress bar at top tracks your place
LAUNCH
⏱ ~10 min
⏱️ 3 MIN · THINK-PAIR-SHARE
Detective Okafor knows the suspect arrived 'no earlier than 2:00 PM,' so t ≥ 2. On the timeline, should the mark at 2 be an open or closed circle, and which way should she shade?
Check for Understanding #1
Teacher: If >30% thumbs down, re-teach with a fresh example before moving on.
Case File: The Timeline
Detective Okafor is building a timeline. The suspect was seen at the scene no earlier than 2:00 PM, meaning the arrival time t satisfies t ≥ 2. She needs to plot this on a timeline to share with her team. How should she mark the number line?
Concept Launch
💡 How do I graph an inequality on a number line?
Graphing an inequality shows every value that makes it true. I draw a circle at the boundary number and shade the side that works. The circle tells me if the boundary is included.
Graphing Inequalities on the Number Line. 1. Draw the boundary circle at the given constant number. 2. Open Circle (○) for < or > (boundary value is not included in solution set). 3. Closed Circle (●) for ≤ or ≥ (boundary value is included). Shade right for >, left for <
Check for Understanding #2
Teacher: If >30% thumbs down, re-teach with a fresh example before moving on.
Now it's your turn
VOCABULARY
⏱ ~8 min
| Term / Término | Meaning / Significado | Example / Ejemplo | Visual |
|---|---|---|---|
| Graph Inequalities Representar desigualdades en una recta numérica |
Show every solution to an inequality on a number line with a boundary point and an arrow. Mostrar cada solución de una desigualdad en una recta numérica con un punto límite y una flecha. |
x > 3 uses an open circle at 3 and an arrow to the right. | |
| Number line Recta numérica |
A straight line where numbers are placed in order; numbers get smaller to the left and larger to the right. Una recta donde los números se colocan en orden; los números son menores a la izquierda y mayores a la derecha. |
A horizontal line with marks at 0, 1, 2, 3, ... showing where values fall | |
| Open circle Círculo abierto |
An empty circle showing a number is NOT included. Un círculo vacío que muestra que un número NO está incluido. |
x > 5: open circle at 5 means 5 itself is NOT a solution, but 5.1, 6, 7, ... are | |
| Closed circle Círculo cerrado |
A filled-in circle showing a number IS included. Un círculo relleno que muestra que un número SÍ está incluido. |
x ≥ 5: closed circle at 5 means 5 IS a solution, and so are 6, 7, 8, ... | |
| Solution set Conjunto solución |
All the numbers that make the inequality true. Todos los números que hacen verdadera la desigualdad. |
For x > 3, the solution set includes 3.1, 4, 5, 10, 100 — any number greater than 3 | |
| Inequality Desigualdad |
A math sentence that compares two sides with <, >, ≤, or ≥. Una oración matemática que compara dos lados con <, >, ≤ o ≥. |
x ≥ 3 is an inequality; it is graphed as a closed circle on 3 with an arrow to the right. |
Which Word Fits?
Mark the ___ ___, then shade every value that makes it true.
Use It In a Sentence
Check for Understanding #3
Teacher: If >30% thumbs down, re-teach with a fresh example before moving on.
Turn & Talk — Launch
Detective Okafor knows the suspect arrived 'no earlier than 2:00 PM,' so t ≥ 2. On the timeline, should the mark at 2 be an open or closed circle, and which way should she shade?
👂 Listen For
Students choose a closed circle at 2 (because 'no earlier than' includes 2) and shade to the right since later times satisfy t ≥ 2.
Extend: How would the timeline look different if the clue were t > 2 instead of t ≥ 2? Justify the change in the circle.
EXPLORE & PRACTICE
⏱ ~18 min
Visual Modeling Workspace
Use the drawing tray below to annotate the visual model. Teacher: say "Click to reveal" on key steps.
Explore Activity
Graph each inequality on the number line. Decide whether to use an open or closed circle, then shade in the correct direction.
✍️ Explore Discourse
How do you decide between an open circle and a closed circle when graphing?
Whiteboard Moment
Show your work clearly. Be ready to explain your thinking to a partner.
Turn & Talk — Explore
When you graphed x > 4 and x ≤ 7, why did you use an open circle on one and a closed circle on the other?
👂 Listen For
Students connect > and < to open circles (boundary not included) and ≥ and ≤ to closed circles, and shade toward the values in the solution set.
Extend: Why does the graph of x > 4 represent infinitely many solutions even though it starts at one point? Explain using the solution set.
Practice Check A
A number line shows a closed circle at 8 and is shaded to the left. Which inequality does this represent?
✍️ Show Your Work
Explain why your answer is correct using today's vocabulary.
Practice Check B
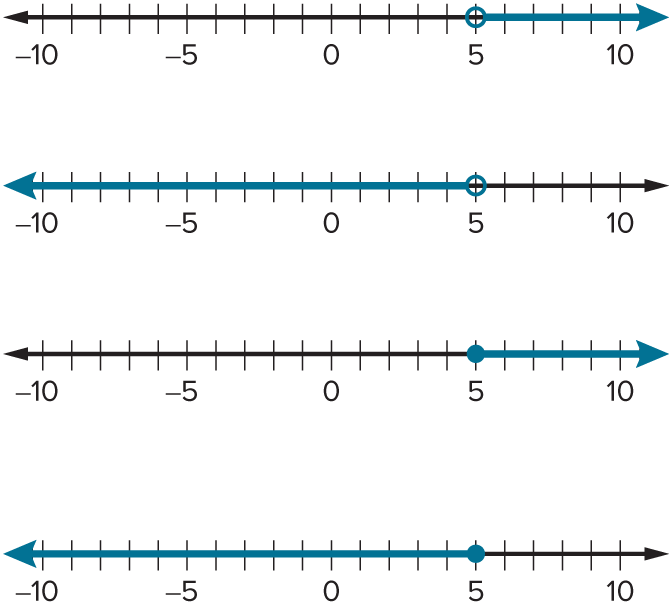
Which graph represents x < 5?
✍️ Show Your Work
Explain why your answer is correct using today's vocabulary.
Equivalent Ratio Sort
Complete the interactive activity using today's strategy.
✍️ Justify Your Thinking
Detective Okafor is filing clues. Sort each inequality by the circle its graph uses.
A classmate turned in the work below. One step has a mistake. Read every step, find it, name it, and fix it.
Choose ONE option to show what you know — then do it in the workspace below.
Use evidence from today's lesson to complete each frame.
Today's key idea is: "Graphing Inequalities on the Number Line. 1. Draw the boundary circle at the given constant number. 2. Open Circle (○) for < or > (boundary value is not included in solution set). 3. Closed Circle (●) for ≤ or ≥ (boundary value is included). Shade right for >, left for <" — and it works because ___.
Because Graph Inequalities means ___, but a tricky part is ___, so I have to ___.
A common mistake with Graph Inequalities is ___. It happens because ___, and the fix is ___.
I can prove my answer is correct by ___, using Number line to check my work.
✍️ TWR · WRITE 3 SENTENCES · 7 MIN
Graphing Inequalities on the Number Line. 1. Draw the boundary circle at the given constant number. 2. Open Circle (○) for < or > (boundary value is not included in solution set). 3. Closed Circle (●) for ≤ or ≥ (boundary value is included). Shade right for >, left for < because ___
Graphing Inequalities on the Number Line. 1. Draw the boundary circle at the given constant number. 2. Open Circle (○) for < or > (boundary value is not included in solution set). 3. Closed Circle (●) for ≤ or ≥ (boundary value is included). Shade right for >, left for < but ___
Graphing Inequalities on the Number Line. 1. Draw the boundary circle at the given constant number. 2. Open Circle (○) for < or > (boundary value is not included in solution set). 3. Closed Circle (●) for ≤ or ≥ (boundary value is included). Shade right for >, left for < so ___
🌱 TWR · GROW THE KERNEL · 6 MIN
Answer these to add detail
Sentence starters (tap to use)
Student Workspace
Graph each inequality on the number line. Decide whether to use an open or closed circle, then shade in the correct direction.
| Column A | Column B |
|---|---|
✏️ Sketch Your Strategy
Differentiation Paths
Step-by-step with a worked model and sentence frames.
Which graph represents x < 5?
Core practice aligned to the standard.
Extension with error analysis or multi-step reasoning.
Partner Activity
Work with your partner on the practice problems at your differentiation path level. Explain each step using math vocabulary.
Check for Understanding #4
Teacher: If >30% thumbs down, re-teach with a fresh example before moving on.
Real-World Connection
🌍 Math in the Wild
A detective determines that fewer than 12 people were at the scene. The inequality p < 12 represents the number of people p. She graphs this with an open circle at 12 and shading to the left.
✍️ Connection Reasoning
Why did the detective use an open circle instead of a closed circle? What values of p are possible?
The detective used an open circle because ___ means 12 is ___ included, so possible values are numbers ___ than 12.
Turn & Talk — Connect
When would graphing an inequality show a real-life limit better than a single number?
👂 Listen For
Students name a real limit (minimum age, max weight, earliest time) and explain the circle type shows whether the boundary value is allowed.
Extend: Critique: 'An open circle and a closed circle graph the same solution set.' Use x > 5 and x ≥ 5 to show why this is wrong.
Summarize: Understand Inequalities and Their Solutions
Graphing Inequalities on the Number Line. 1. Draw the boundary circle at the given constant number. 2. Open Circle (○) for < or > (boundary value is not included in solution set). 3. Closed Circle (●) for ≤ or ≥ (boundary value is included). Shade right for >, left for <
In your own words:
CLOSURE & REFLECT
⏱ ~8 min
Today I learned that ___ because ___.
One thing I am still not sure about is ___.
How would you graph the inequality x ≥ 9?
Bonus Exit Check
Which graph represents x ≥ 3?
✍️ Show Your Work
Explain why your answer is correct using today's vocabulary.
Reflection & Self-Assessment
Continue Learning
Launch the Full Interactive Activity
Students continue practice in the HTML lesson engine with auto-check, hints, and differentiation.
Family Connection
Share tonight's family homework and discuss one vocabulary word at home.
Open Family Homework ↗Teacher Notes
⏱️ Pacing Guide
- Launch & vocab: 12 min
- I Do / We Do / You Do: 15 min
- Explore & practice: 15 min
- Connect & closure: 8 min
Total: ~45 min
🎯 Listen For · Common Errors
• Students choose a closed circle at 2 (because 'no earlier than' includes 2) and shade to the right since later times satisfy t ≥ 2.
• Students connect > and < to open circles (boundary not included) and ≥ and ≤ to closed circles, and shade toward the values in the solution set.
• Students name a real limit (minimum age, max weight, earliest time) and explain the circle type shows whether the boundary value is allowed.
• Listen for students naming a specific strategy tied to 6.AT.9 — not just "I picked a circle." They should explain how they checked the symbol (< , >, ≤, ≥) before choosing the circle type and shading direction.
Common mistake: A common mistake in Graph Inequalities is treating ≥ and ≤ the same as > and < and drawing the wrong circle. For example, students often graph x ≥ 6 with an OPEN circle (as if it were x > 6), which wrongly excludes 6 even though 6 itself makes x ≥ 6 true. A second common mistake is choosing the right circle but shading the wrong direction — for x < 9 students sometimes shade right instead of left. Always check the symbol twice: once for the circle (does it have an 'or equal to' line?) and once for the shading direction (does the symbol point toward larger or smaller numbers?).
Answer Key (Teacher Appendix)
Hide this slide during presentation or move to the end of your copy.
✓ Practice 1: x ≤ 8 — Closed circle means the value is included (≤ or ≥). Shaded left means less than or equal to: x ≤ 8.
✓ Practice 2: Open circle at 5, shaded left — x < 5 means 5 is NOT included (open circle) and values less than 5 are shaded (left).
✓ Practice 3: Closed circle at 3, shaded right — x ≥ 3 means 3 IS included (closed circle) and values greater than or equal to 3 are shaded (right).
✓ Practice 4: Open circle at 8, shaded right — x > 8 means 8 is NOT included (open circle) and values greater than 8 are shaded to the right.
✓ Exit ticket: Closed circle at 9, shaded right — x ≥ 9 means 9 is included (closed circle) and values are 9 or greater (shaded right).