Touch and changeToca y cambia
Move, type, tap, or drag in the model. Watch what changes.Mueve, escribe, toca o arrastra en el modelo. Observa qué cambia.
Unit 8 · 6.AT.8
Solve and Graph Inequalities · Lesson 8-6
English: Use the pictures and short steps. Ask questions; let your student do the thinking. Español: Usen los dibujos y los pasos cortos. Hagan preguntas; dejen que su estudiante piense.
Tonight we solve an inequality and then graph it. We get the letter alone the same way as an equation, but the answer is a range of values.
Esta noche resolvemos una desigualdad y luego la graficamos. Dejamos la letra sola igual que en una ecuación, pero la respuesta es un rango de valores.
Follow the picture pathSigan la ruta visual
Real example: solve and graph x + 3 > 53 (the suspect withdrew more than $50, plus a $3 fee).
Ejemplo real: resuelve y grafica x + 3 > 53 (el sospechoso retiró más de $50, más una comisión de $3).
Use the inverse operation.
Usa la operación inversa.
The opposite of adding 3 is subtracting 3: x + 3 − 3 > 53 − 3, so x > 50.
Lo opuesto de sumar 3 es restar 3: x + 3 − 3 > 53 − 3, así que x > 50.
Graph it.
Grafícalo.
The symbol > does not include 50, so draw an open circle at 50 and shade right.
El símbolo > no incluye el 50, así que dibuja un círculo abierto en el 50 y sombrea a la derecha.
Check by substituting a value: x = 60 gives 60 + 3 = 63, and 63 > 53 is true.
Comprueba sustituyendo un valor: x = 60 da 60 + 3 = 63, y 63 > 53 es verdadero.
Listen for "substitute" (sustituir) — it means putting a number in for the letter to check it works.
Escucha la palabra "sustituir" — significa poner un número en lugar de la letra para revisar que funciona.
Listen for "solution set" (conjunto solución) — all the values that make the inequality true, not just one.
Escucha "conjunto solución" — todos los valores que hacen verdadera la desigualdad, no solo uno.
The circle must match the symbol from the SOLVED inequality. Ask "Open or closed for this symbol?"
El círculo debe coincidir con el símbolo de la desigualdad RESUELTA. Pregunta "¿Abierto o cerrado para este símbolo?"
Use the same interactive model from the lesson. Change it, notice the pattern, and explain what the model shows.Usa el mismo modelo interactivo de la lección. Cámbialo, observa el patrón y explica lo que muestra.
Move, type, tap, or drag in the model. Watch what changes.Mueve, escribe, toca o arrastra en el modelo. Observa qué cambia.
Record one equation, value, or relationship you can see.Escribe una ecuación, un valor o una relación que puedas ver.
I notice ___ changes when ___ changes. This shows ___.Noto que ___ cambia cuando ___ cambia. Esto muestra ___.
Solving & Graphing One-Step Inequalities. 1. Isolate the variable using inverse operations on both sides (same as equations). 2. Write the simplified inequality with the variable on the left (e.g. x > 5). 3. Graph the solution set on a number line with open/closed circle and arrow shading
A quick, no-timer review game for tonight's lesson — sort, match, and choose. A wrong answer just gives a hint and lets your student try again. Un juego de repaso sin reloj para la lección de hoy — clasificar, emparejar y elegir. Si se equivocan, reciben una pista y pueden intentar de nuevo.
↗ Play full screen ↗ Jugar en pantalla completa
Tap a card to flip. Use these words when you talk about the math together. Toquen una tarjeta para voltearla. Usen estas palabras cuando hablen de la matemática juntos.
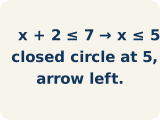
Resolver y representar desigualdades
Isolate the variable, then show the complete solution set on a number line.
Aislar la variable y luego mostrar el conjunto completo de soluciones en una recta numérica.
📌 x + 2 ≤ 7 → x ≤ 5; closed circle at 5, arrow left.
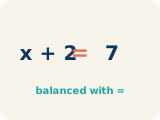
Resolver
To find the number that makes it true.
Encontrar el número que la hace verdadera.
📌 x + 3 > 10 → subtract 3 → x > 7 — any number greater than 7 works
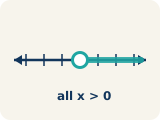
Graficar
To show answers on a number line with circles and shading.
Mostrar respuestas en una recta numérica con círculos y sombreado.
📌 x > 7: open circle at 7, shade right — shows all solutions at a glance
Solución
A number that makes the equation or inequality true.
Un número que hace verdadera la ecuación o desigualdad.
📌 x = 8 is a solution to x > 7 because 8 > 7 is true; x = 5 is not because 5 > 7 is false
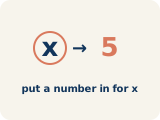
Sustituir
To put a number in place of a letter.
Poner un número en lugar de una letra.
📌 Substitute x = 5 into x + 3 > 10: 5 + 3 = 8, and 8 > 10 is false, so x = 5 is not a solution
Conjunto solución
All the numbers that make the inequality true.
Todos los números que hacen verdadera la desigualdad.
📌 For x > 4, the solution set is every number greater than 4, such as 5, 6, 7, ...
Operación inversa
Two math actions that undo each other, like × and ÷.
Dos operaciones que se deshacen entre sí, como × y ÷.
📌 To solve x + 3 > 7, use the inverse of adding 3: subtract 3 to get x > 4.
Detective Kim has another clue: x − 5 ≤ 8. Solve and graph it together.
La detective Kim tiene otra pista: x − 5 ≤ 8. Resuélvanla y grafíquenla juntos.
Work side by side. You ask questions; your student does the thinking. Trabajen juntos. Tú haces preguntas; tu estudiante piensa.
Solve it. The inverse of subtracting 5 is adding 5: x ≤ 8 + 5, so x ≤ 13.
Resuélvanla. El inverso de restar 5 es sumar 5: x ≤ 8 + 5, así que x ≤ 13.
Graph it. The symbol ≤ includes 13, so draw a closed circle at 13 and shade left.
Grafíquenla. El símbolo ≤ incluye el 13, así que dibujen un círculo cerrado en el 13 y sombreen a la izquierda.
Check by substituting: try x = 10. Does 10 − 5 = 5, and is 5 ≤ 8?
Comprueben sustituyendo: prueben x = 10. ¿10 − 5 = 5, y es 5 ≤ 8?
Do these together. Start at ★ and climb to ★★★ when ready. Háganlos juntos. Empiecen en ★ y suban a ★★★ cuando estén listos.
Solve: x + 6 > 14
A. x > 8
Solve: x − 9 ≤ 3
A. x ≤ 12
Is x = 5 a solution to x + 4 > 12?
A. No, because 5 + 4 = 9, and 9 is not greater than 12
Clue 1: Which value is a solution of x > 7?
A. 9
A detective has a budget of at most $100 for supplies. She already spent $37 on gloves. Write an inequality for the remaining amount r she can spend, solve it, graph it, and name three possible values for r.
⏱️ Plan on about 15–20 minutes for the 6 problems below. The extra practice at the bottom is optional. ⏱️ Calculen unos 15–20 minutos para los 6 problemas de abajo. La práctica extra al final es opcional.
A few problems to practice together. Each one has a step-by-step guide, a picture to draw on, and a space to show your work. Use Check This Problem for instant feedback — no need to finish everything at once. Unos problemas para practicar juntos. Cada uno tiene una guía paso a paso, un dibujo para trabajar y un espacio para mostrar el trabajo. Usen Revisar esta pregunta para retroalimentación al instante — no tienen que terminar todo de una vez.
Easier problems to practice the idea. Do these first together. Problemas más fáciles para practicar la idea. Hagan estos primero juntos.
Solve each inequality, describe the inverse operation, and describe the graph.Resuelve cada desigualdad, describe la operación inversa y describe la gráfica.
👪 Encourage your student to show work on paper if a box feels tricky.👪 Animen a mostrar el trabajo en papel si una casilla se siente difícil.
| Inequality | Inverse Operation | Solution | Graph Description |
|---|---|---|---|
| x + 11 ≥ 20 | Subtract 11 | x ≥ 9 | Closed circle at 9, shade right |
| x − 3 < 7 | Add 3 | x < 10 | Open circle at 10, shade left |
| x + 8 ≤ 20 | Subtract 8 | x ≤ 12 | Closed circle at 12, shade left |
Lock-and-key match: connect each badge number to the one inequality it is a solution of. Substitute to check that each value makes its inequality true.Cerradura y llave: conecta cada número de placa con la única desigualdad de la que es solución. Sustituye para comprobar que cada valor hace verdadera su desigualdad.
👪 Say each term out loud, then talk through which match makes sense before choosing.👪 Digan cada término en voz alta y hablen de cuál pareja tiene sentido antes de elegir.
Final gate — describe the solution set. The vault rule is x > 7. What does the solution set mean?Puerta final: describe el conjunto solución. La regla de la bóveda es x > 7. ¿Qué significa el conjunto solución?
👪 Read the question together, then let your student pick an answer before you discuss why.👪 Lean la pregunta juntos; dejen que su estudiante elija antes de hablar del porqué.
Try these once the warm-up feels easy. It's okay to use the steps and pictures. Intenten estos cuando el calentamiento sea fácil. Está bien usar los pasos y los dibujos.
Solve each inequality, then test if x = 10 is a solution.Resuelve cada desigualdad y después comprueba si x = 10 es una solución.
👪 On a phone, use Move to. On a computer, drag cards or tap a card then tap a column.👪 En el teléfono usen Mover a. En la computadora arrastren o toquen tarjeta y columna.
💡 First solve the inequality to find the solution set. Then check if 10 is in that set.Primero resuelve la desigualdad para hallar el conjunto solución. Luego revisa si el 10 está en ese conjunto.
💡 For x > 12: is 10 > 12? No. For x > 6: is 10 > 6? Yes.Para x > 12: ¿es 10 > 12? No. Para x > 6: ¿es 10 > 6? Sí.
Detective, sort each suspect's badge number into the right vault door for the rule x ≥ 4. A value is a solution if it makes x ≥ 4 true.Detective, clasifica el número de placa de cada sospechoso en la puerta de bóveda correcta para la regla x ≥ 4. Un valor es solución si hace que x ≥ 4 sea verdadero.
👪 On a phone, use Move to. On a computer, drag cards or tap a card then tap a column.👪 En el teléfono usen Mover a. En la computadora arrastren o toquen tarjeta y columna.
Solve each inequality and verify by testing two values.Resuelve cada desigualdad y comprueba probando dos valores.
👪 Encourage your student to show work on paper if a box feels tricky.👪 Animen a mostrar el trabajo en papel si una casilla se siente difícil.
| Inequality | Solution | Test x = 5 | Test x = 20 |
|---|---|---|---|
| x + 8 > 15 | x > 7 | 5 + 8 = 13 > 15? No | 20 + 8 = 28 > 15? Yes |
| x − 6 ≤ 10 | x ≤ 16 | 5 − 6 = −1 ≤ 10? Yes | 20 − 6 = 14 ≤ 10? No |
Optional. Only if your student wants more — these are bonus problems. Opcional. Solo si tu estudiante quiere más — son problemas adicionales.
Clue 2: Is 5 a solution of x ≤ 5?Pista 2: ¿es 5 una solución de x ≤ 5?
👪 Read the question together, then let your student pick an answer before you discuss why.👪 Lean la pregunta juntos; dejen que su estudiante elija antes de hablar del porqué.
A detective has a budget of at most $100 for supplies. She already spent $37 on gloves. Write an inequality for the remaining amount r she can spend, solve it, graph it, and name three possible values for r.Una detective tiene un presupuesto de a lo más $100 para materiales. Ya gastó $37 en guantes. Escribe una desigualdad para la cantidad restante r que puede gastar, resuélvela, grafícala y nombra tres valores posibles de r.
👪 A complete sentence with math vocabulary is the goal — not a perfect paragraph.👪 Una oración completa con vocabulario matemático es la meta — no un párrafo perfecto.
Is x = 5 a solution to x + 4 > 12?¿Es x = 5 una solución de x + 4 > 12?
👪 Read the question together, then let your student pick an answer before you discuss why.👪 Lean la pregunta juntos; dejen que su estudiante elija antes de hablar del porqué.
Clue 1: Which value is a solution of x > 7?Pista 1: ¿cuál valor es una solución de x > 7?
👪 Read the question together, then let your student pick an answer before you discuss why.👪 Lean la pregunta juntos; dejen que su estudiante elija antes de hablar del porqué.
Solve: x + 6 > 14Resuelve: x + 6 > 14
👪 Read the question together, then let your student pick an answer before you discuss why.👪 Lean la pregunta juntos; dejen que su estudiante elija antes de hablar del porqué.
Solve: x − 9 ≤ 3Resuelve: x − 9 ≤ 3
👪 Read the question together, then let your student pick an answer before you discuss why.👪 Lean la pregunta juntos; dejen que su estudiante elija antes de hablar del porqué.
Solve: x + 10 ≥ 25Resuelve: x + 10 ≥ 25
👪 Read the question together, then let your student pick an answer before you discuss why.👪 Lean la pregunta juntos; dejen que su estudiante elija antes de hablar del porqué.
Solve: x − 4 < 11Resuelve: x − 4 < 11
👪 Read the question together, then let your student pick an answer before you discuss why.👪 Lean la pregunta juntos; dejen que su estudiante elija antes de hablar del porqué.
A digital scratch pad to draw models, line up decimals, and show your work. It opens in a new tab so you keep your place on this homework. Una pizarra digital para dibujar modelos, alinear decimales y mostrar el trabajo. Se abre en una pestaña nueva para no perder tu lugar en esta tarea.
🧮 Open the Math Workbench ↗ 🧮 Abrir la Pizarra de matemáticas ↗
What is being added or subtracted? Use the opposite to get x alone.
¿Qué se está sumando o restando? Usa lo opuesto para dejar x sola.
Look at the symbol now: does it include the boundary number — open or closed circle?
Mira el símbolo ahora: ¿incluye el número límite — círculo abierto o cerrado?
Let's substitute a number from the shaded side to check it is true.
Sustituyamos un número del lado sombreado para revisar que es verdadero.
The answer to an inequality is one number, like an equation.
La respuesta de una desigualdad es un solo número, como una ecuación.
Use a closed circle for every inequality.
Usa un círculo cerrado para toda desigualdad.
You don't need to check by substituting a value.
No necesitas comprobar sustituyendo un valor.
These links go to specific videos and lessons about tonight's topic — not general math pages. Estos enlaces van a videos y lecciones específicas sobre el tema de hoy — no páginas generales.
Reinforce tonight's topic with a quick family game. You ask; your student decides! Refuercen el tema de hoy con un juego rápido en familia. ¡Ustedes preguntan; su estudiante decide!
🎮 Play together! Test values: substitute to see if the inequality is true. 🎮 ¡Jueguen juntos! Prueben valores: sustituyan para ver si la desigualdad es verdadera.
High five! Whether every answer was perfect or not, you showed up for your student tonight. That matters.
¡Chócalas! No importa si cada respuesta fue perfecta — estuviste con tu estudiante esta noche. Eso importa.
Answers save automatically on this device. Tap Check This Problem anytime. Las respuestas se guardan solas en este dispositivo. Toquen Revisar esta pregunta cuando quieran.
Signed on:Firmado el:
Note to teacher / Nota para el maestro:
This certifies that the homework for was completed and reviewed collaboratively.
Parent/Guardian Signature
Date