Unit 2 · Understanding the World Around Us Through StatisticsUnidad 2 · Entender el mundo que nos rodea con la estadística · Lesson 2-1 · Session 2: Compare & ApplyLección 2-1 · Sesión 2: Comparar y aplicar
Dot Plots and ShapeDiagramas de puntos y su forma
NameNombreDateFecha
Optional practice. Try each problem first, then talk it over with a grown-up.Práctica opcional. Intenta cada problema primero y luego conversa con un adulto.
Unit 2 · Understanding the World Around Us Through StatisticsUnidad 2 · Entender el mundo que nos rodea con la estadística
At the library, twelve students told how many books they finished: 0, 2, 1, 2, 3, 2, 4, 1, 2, 3, 0, 2. Which number of books did the most students say?En la biblioteca, doce estudiantes dijeron cuántos libros terminaron: 0, 2, 1, 2, 3, 2, 4, 1, 2, 3, 0, 2. ¿Qué cantidad de libros dijeron más estudiantes?
Today's Family PracticeLa práctica familiar de hoy
Five short steps, about 15–20 minutes: watch the idea, try one together, solve 10 in three levels, check, celebrate.Cinco pasos cortos, unos 15–20 minutos: miren la idea, prueben uno juntos, resuelvan 10 en tres niveles, revisen y celebren.
Optional. No grades, no account. Your place is saved on this device.Opcional. Sin calificaciones ni cuenta. Su avance se guarda en este dispositivo.
Tonight's ideaLa idea de hoyDraw every answer as a dot on a number line and describe the shape.Dibujar cada respuesta como un punto en una recta numérica y describir la forma.
15–20 min
Pencil and paperLápiz y papel
Goal:Meta:10problemsproblemas
✏️Family Math ScratchpadPizarra Familiar de Matemáticas
💡 Draw fraction bars, tape diagrams, equations, or line up decimals together!💡 ¡Dibujen barras de fracciones, modelos o alineen decimales juntos!
Step 1 of 5Paso 1 de 5
Look & LearnMira y aprende
Read the goal and look at the picture. Then go through the example one step at a time.Lean la meta y miren el dibujo. Luego sigan el ejemplo un paso a la vez.
✦
Start with one ideaEmpieza con una idea
Draw every answer as a dot on a number line and describe the shape.
Dibujar cada respuesta como un punto en una recta numérica y describir la forma.
The picture for tonightEl dibujo de hoy
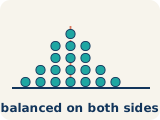
In class we usedEn clase usamosone dot for every answerun punto por cada respuesta.
Show the full example, one step at a timeVer el ejemplo completo, paso a paso
Write down the twelve answers: 0, 2, 1, 2, 3, 2, 4, 1, 2, 3, 0, 2 books finished.Anota las doce respuestas: 0, 2, 1, 2, 3, 2, 4, 1, 2, 3, 0, 2 libros terminados.
Draw a number line from 0 to 4. Stack one dot above a number for each student who said it.Dibuja una recta numérica del 0 al 4. Apila un punto sobre un número por cada estudiante que lo dijo.
Count the dots in each stack: 0 has 2, 1 has 2, 2 has 5, 3 has 2, 4 has 1.Cuenta los puntos de cada pila: el 0 tiene 2, el 1 tiene 2, el 2 tiene 5, el 3 tiene 2 y el 4 tiene 1.
Find the tallest stack: 5 dots above 2. So 2 books is the most common answer. That stack is the peak.Halla la pila más alta: 5 puntos sobre el 2. Entonces 2 libros es la respuesta más común. Esa pila es el pico.
Look at the shape: the stacks rise to the peak at 2, then drop on both sides, so it is nearly symmetric.Mira la forma: las pilas suben hasta el pico en el 2 y bajan a ambos lados, así que es casi simétrica.
Why it worksPor qué funcionaA stack of dots and a row of tally marks both count how many times each answer appears. The dot plot also shows the shape at a glance.Una pila de puntos y una fila de rayitas cuentan cuántas veces aparece cada respuesta. El diagrama de puntos además muestra la forma de un vistazo.
Words to know (optional)Palabras que conviene saber (opcional)
Case file · Lesson 2-1Expediente · Lección 2-1
Dot Plots and ShapeDiagramas de puntos y su forma
Your case:Su caso:Tonight we take the answers collected from a statistical question and draw them as a dot plot, then describe the shape the dots make.Esta noche tomamos las respuestas recogidas de una pregunta estadística y las dibujamos como un diagrama de puntos, y luego describimos la forma que hacen los puntos.
Tap a clue to read what it means.Toquen una pista para leer qué significa.
Say what you notice (optional)Cuenten qué notan (opcional)
What do you notice?¿Qué notas?
Look at the picture and the story. Say it out loud, or type a few words. There is no wrong answer here.Mira el dibujo y la historia. Dilo en voz alta o escribe unas palabras. Aquí no hay respuestas incorrectas.
Quick look back (optional)Un repaso rápido (opcional)
How sure do you feel about today's math?¿Qué tan seguro o segura te sientes con la matemática de hoy?
Just for you. It stays on this device. We ask again at the end.Solo para ti. Se queda en este dispositivo. Preguntamos otra vez al final.
RememberRecuerda
Remember these?¿Recuerdas esto?
A coach lists the points each player scored per game: 8, 12, 12, 15, 18, 20, 22. How many players is that?Un entrenador anota los puntos de cada jugador por juego: 8, 12, 12, 15, 18, 20, 22. ¿Cuántos jugadores son?
Not yet. Try another look.Todavía no. Intenta otra mirada.
Each score is one player's answer. Count them: 7 players.Cada anotación es la respuesta de un jugador. Cuéntalas: 7 jugadores.
A bag of chips costs $2.50. What do 4 bags cost?Una bolsa de papitas cuesta $2.50. ¿Cuánto cuestan 4 bolsas?
Not yet. Try another look.Todavía no. Intenta otra mirada.
4 × $2.50 = $10.00.4 × $2.50 = $10.00.
Step 2 of 5Paso 2 de 5
Try TogetherPrueben juntos
Do this one side by side. Use the model, and ask for a hint whenever you want one.Háganlo lado a lado. Usen el modelo y pidan una pista cuando quieran.
Try this one togetherPrueben este juntos
Ten students said how many apps they added last week: 0, 1, 3, 1, 2, 1, 4, 1, 2, 0.Diez estudiantes dijeron cuántas aplicaciones agregaron la semana pasada: 0, 1, 3, 1, 2, 1, 4, 1, 2, 0.
Count how many dots belong above each number from 0 to 4. How many dots should there be in all?Cuenten cuántos puntos corresponden a cada número del 0 al 4. ¿Cuántos puntos debe haber en total?
HintPista
Ten students means exactly ten dots in all: 0 (two), 1 (four), 2 (two), 3 (one), 4 (one).Diez estudiantes significa exactamente diez puntos en total: 0 (dos), 1 (cuatro), 2 (dos), 3 (uno), 4 (uno).
More helpMás ayuda
Tally the count for each number from 0 to 4; the total count must equal 10.Anoten el conteo de cada número del 0 al 4; el conteo total debe ser igual a 10.
Which value has the tallest stack? What does that tell you?¿Qué valor tiene la pila más alta? ¿Qué les dice eso?
HintPista
The value 1 appears four times, more than any other — it is the most common answer.El valor 1 aparece cuatro veces, más que cualquier otro — es la respuesta más común.
More helpMás ayuda
Count how many times each number appears in the list first, then check your totals.Cuenten cuántas veces aparece cada número en la lista, luego revisen sus totales.
What are the least and greatest values, and is the shape symmetric?¿Cuáles son el valor menor y el mayor, y la forma es simétrica?
HintPista
Least 0, greatest 4. More dots sit on the left, so it leans right — not symmetric.Menor 0, mayor 4. Hay más puntos a la izquierda, así que se inclina a la derecha — no es simétrica.
More helpMás ayuda
Cover one side of the peak with your hand and ask if the other side looks the same.Tapen un lado del pico con la mano y pregunten si el otro lado se ve igual.
TOUCH & TRYTOCA Y PRUEBA
🖐️Dot Plots and ShapeDiagramas de puntos y su forma
Each dot represents one student. Compare stacks and describe the shape; do not calculate measures of center.Esta noche tomamos las respuestas recogidas de una pregunta estadística y las dibujamos como un diagrama de puntos, y luego describimos la forma que hacen los puntos.
1
Touch and changeToca y cambia
Each dot represents one student. Compare stacks and describe the shape; do not calculate measures of center.Esta noche tomamos las respuestas recogidas de una pregunta estadística y las dibujamos como un diagrama de puntos, y luego describimos la forma que hacen los puntos.
2
Write the mathEscribe las matemáticas
The dots run from 0 to 4 and there are about as many on each side of the peak, so the shape is nearly symmetric.Los puntos van del 0 al 4 y hay casi la misma cantidad a cada lado del pico, así que la forma es casi simétrica.
3
Explain the modelExplica el modelo
A dot plot is a number line with one dot for every single answer. Stacking the dots makes the answers easy to read at a glance: the tallest stack is the most common answer, and the two ends show the least and the greatest.Un diagrama de puntos es una recta numérica con un punto por cada respuesta. Apilar los puntos hace que las respuestas se lean de un vistazo: la pila más alta es la respuesta más común, y los dos extremos muestran el menor y el mayor.
💬 Family conversation:Conversación familiar:
Ask: "Where do you see the numbers from tonight's math in this model?"Pregunta: "¿Dónde ves los números de la tarea de hoy en este modelo?"
More ways to see it (optional)Más formas de verlo (opcional)
🎯The big ideaLa idea principal
✦
Start with one ideaEmpieza con una idea
Draw every answer as a dot on a number line and describe the shape.
Dibujar cada respuesta como un punto en una recta numérica y describir la forma.
One dot for each studentUn punto por estudiante
Books finished: 0, 2, 1, 2, 3, 2, 4, 1, 2, 3, 0, 2. The tallest stack is at 2 books. Describe the shape on either side.Libros terminados: 0, 2, 1, 2, 3, 2, 4, 1, 2, 3, 0, 2. La pila más alta está en 2 libros. Describe la forma de ambos lados.
Each dot represents one student. The peak is at 2 books; the two sides are nearly symmetric.Cada punto representa un estudiante. El pico está en 2 libros; ambos lados son casi simétricos.Why this worksPor qué funciona
A dot plot is a number line with one dot for every single answer. Stacking the dots makes the answers easy to read at a glance: the tallest stack is the most common answer, and the two ends show the least and the greatest.
Un diagrama de puntos es una recta numérica con un punto por cada respuesta. Apilar los puntos hace que las respuestas se lean de un vistazo: la pila más alta es la respuesta más común, y los dos extremos muestran el menor y el mayor.
1
🎯Set upPlanteaStep 1Paso 1
Write down the twelve answers: 0, 2, 1, 2, 3, 2, 4, 1, 2, 3, 0, 2 books finished.
Anota las doce respuestas: 0, 2, 1, 2, 3, 2, 4, 1, 2, 3, 0, 2 libros terminados.
2
🧩ModelModelaStep 2Paso 2
Draw a number line from 0 to 4.
Dibuja una recta numérica del 0 al 4.
More detailMás detalle
Stack one dot above a number for each student who said it.
Apila un punto sobre un número por cada estudiante que lo dijo.
3
✏️SolveResuelveStep 3Paso 3
Count the dots in each stack: 0 has 2, 1 has 2, 2 has 5, 3 has 2, 4 has 1.
Cuenta los puntos de cada pila: el 0 tiene 2, el 1 tiene 2, el 2 tiene 5, el 3 tiene 2 y el 4 tiene 1.
4
✅CheckRevisaStep 4Paso 4
Find the tallest stack: 5 dots above 2.
Halla la pila más alta: 5 puntos sobre el 2.
More detailMás detalle
So 2 books is the most common answer. That stack is the peak.
Entonces 2 libros es la respuesta más común. Esa pila es el pico.
5
✅CheckRevisaStep 5Paso 5
Look at the shape: the stacks rise to the peak at 2, then drop on both sides, so it is nearly symmetric.
Mira la forma: las pilas suben hasta el pico en el 2 y bajan a ambos lados, así que es casi simétrica.
Watch for these (3)Ten en cuenta (3)
👀
Listen for "dot plot" (diagrama de puntos) — one dot equals one answer, never a group of answers.
Escuchen "diagrama de puntos" — un punto es una respuesta, nunca un grupo de respuestas.
🔺
Listen for "symmetric" (simétrico) — it means the two sides of the plot look about the same around the tallest stack.
Escuchen "simétrico" — significa que los dos lados del diagrama se ven casi iguales alrededor de la pila más alta.
✋
Have your student count the dots and compare that to how many people answered. They must match.
Pidan a su estudiante que cuente los puntos y los compare con cuántas personas respondieron. Deben coincidir.
Step 3 of 5Paso 3 de 5
Your TurnTu turno
One at a time. Work on your own; a grown-up can watch.Uno a la vez. Trabaja solo; un adulto puede observar.
10 problems. Hints are always okay.10 problemas. Las pistas siempre están bien.
+0bonusextra
🔥Streak: 1 in a row! Keep going!¡Racha: 1 seguidas! ¡Sigue así!
🌟
Your Turn is done.Tu turno terminó.
Next, see what your answers show and fix one.Ahora vean qué muestran sus respuestas y corrijan una.
Problem 1 of 13Problema 1 de 13
A · Understand itA · Entiéndelo
Need a hint?¿Quieres una pista?
Every answer gets its own dot.
Cada respuesta tiene su propio punto.
If 10 students answered, how many dots would there be?
Si respondieron 10 estudiantes, ¿cuántos puntos habría?
Make one try first. Hint 3 opens after your first answer.Haz un intento primero. La pista 3 se abre después de tu primera respuesta.
Each dot stands for one answer from the data. So the answer is: One answer from the data.
Cada punto representa una respuesta de los datos. Entonces la respuesta es: Una respuesta de los datos.
In a dot plot, what does each dot stand for?En un diagrama de puntos, ¿qué representa cada punto?
✏️ Workspace: draw, type, or get a guided start✏️ Espacio de trabajo: dibuja, escribe o empieza con guía● saved● guardado
✏️ Draw your model: If 10 students answered, how many dots would there be?✏️ Dibuja tu modelo: Si respondieron 10 estudiantes, ¿cuántos puntos habría?
🔑Show the answerVer la respuesta
Answer key for families — compare, then talk about why.Clave de respuestas para la familia — comparen y hablen del porqué.
Not tried yet? Close this and give it one try first. A wrong first try still helps.¿Todavía no lo intentaron? Ciérrenla y hagan un intento primero. Un primer intento equivocado también ayuda.
One answer from the dataUna respuesta de los datos
Why:Por qué:Each dot stands for one answer from the data. So the answer is: One answer from the data.Cada punto representa una respuesta de los datos. Entonces la respuesta es: Una respuesta de los datos.
B · Solve itB · Resuélvelo
Need a hint?¿Quieres una pista?
More dots in a stack means more people gave that answer.
Más puntos en una pila significa que más personas dieron esa respuesta.
What does a taller stack mean compared to a short one?
¿Qué significa una pila más alta comparada con una baja?
Make one try first. Hint 3 opens after your first answer.Haz un intento primero. La pista 3 se abre después de tu primera respuesta.
The tallest stack is the answer that happened most often, so 5 is the most common answer.
La pila más alta es la respuesta que ocurrió más veces, así que 5 es la respuesta más común.
The tallest stack of dots is above 5. What does that tell you?La pila de puntos más alta está sobre el 5. ¿Qué te dice eso?
✏️ Workspace: draw, type, or get a guided start✏️ Espacio de trabajo: dibuja, escribe o empieza con guía● saved● guardado
✏️ Draw your model: What does a taller stack mean compared to a short one?✏️ Dibuja tu modelo: ¿Qué significa una pila más alta comparada con una baja?
🔑Show the answerVer la respuesta
Answer key for families — compare, then talk about why.Clave de respuestas para la familia — comparen y hablen del porqué.
Not tried yet? Close this and give it one try first. A wrong first try still helps.¿Todavía no lo intentaron? Ciérrenla y hagan un intento primero. Un primer intento equivocado también ayuda.
5 is the most common answer5 es la respuesta más común
Why:Por qué:The tallest stack is the answer that happened most often, so 5 is the most common answer.La pila más alta es la respuesta que ocurrió más veces, así que 5 es la respuesta más común.
C · Use itC · Úsalo
Need a hint?¿Quieres una pista?
Thinking the tallest stack is the greatest value. The tallest stack is the answer that happened most often; the greatest value is the dot farthest right.
Pensar que la pila más alta es el valor mayor. La pila más alta es la respuesta que ocurrió más veces; el valor mayor es el punto más a la derecha.
The tallest stack is above ___, so ___ is the most common answer. The dots look ___.
La pila más alta está sobre ___, así que ___ es la respuesta más común. Los puntos se ven ___.
Make one try first. Hint 3 opens after your first answer.Haz un intento primero. La pista 3 se abre después de tu primera respuesta.
Find every 3 in the list. There are 4, and each one is a dot. Check: 10 answers means 10 dots in all, and 10 − 6 others = 4.
Busca cada 3 en la lista. Hay 4, y cada uno es un punto. Comprueba: 10 respuestas son 10 puntos en total, y 10 − 6 de los otros = 4.
Ten students told how many days they walked to school this week: 0, 3, 3, 2, 3, 1, 3, 5, 2, 2. On a dot plot, how many dots stack above 3?Diez estudiantes dijeron cuántos días caminaron a la escuela esta semana: 0, 3, 3, 2, 3, 1, 3, 5, 2, 2. En un diagrama de puntos, ¿cuántos puntos se apilan sobre el 3?
✏️ Workspace: draw, type, or get a guided start✏️ Espacio de trabajo: dibuja, escribe o empieza con guía● saved● guardado
✏️ Draw your model: The tallest stack is above ___, so ___ is the most common answer. The dots look ___.✏️ Dibuja tu modelo: La pila más alta está sobre ___, así que ___ es la respuesta más común. Los puntos se ven ___.
🔑Show the answerVer la respuesta
Answer key for families — compare, then talk about why.Clave de respuestas para la familia — comparen y hablen del porqué.
Not tried yet? Close this and give it one try first. A wrong first try still helps.¿Todavía no lo intentaron? Ciérrenla y hagan un intento primero. Un primer intento equivocado también ayuda.
4 dots4 puntos
Why:Por qué:Find every 3 in the list. There are 4, and each one is a dot. Check: 10 answers means 10 dots in all, and 10 − 6 others = 4.Busca cada 3 en la lista. Hay 4, y cada uno es un punto. Comprueba: 10 respuestas son 10 puntos en total, y 10 − 6 de los otros = 4.
Set 1: Build ConfidenceSerie 1: Desarrollar confianza
MULTIPLE CHOICEOPCIÓN MÚLTIPLE
Need a hint?¿Quieres una pista?
Circle every 2 in the list.
Encierra en un círculo cada 2 de la lista.
How many times does 2 appear in the list?
¿Cuántas veces aparece el 2 en la lista?
Make one try first. Hint 3 opens after your first answer.Haz un intento primero. La pista 3 se abre después de tu primera respuesta.
The value 2 appears 3 times, so 3 dots go above the number 2.
El valor 2 aparece 3 veces, así que 3 puntos van sobre el número 2.
Data: 1, 2, 2, 2, 4. How many dots go above the number 2?Datos: 1, 2, 2, 2, 4. ¿Cuántos puntos van sobre el número 2?
✏️ Workspace: draw, type, or get a guided start✏️ Espacio de trabajo: dibuja, escribe o empieza con guía● saved● guardado
✏️ Draw your model: How many times does 2 appear in the list?✏️ Dibuja tu modelo: ¿Cuántas veces aparece el 2 en la lista?
🔑Show the answerVer la respuesta
Answer key for families — compare, then talk about why.Clave de respuestas para la familia — comparen y hablen del porqué.
Not tried yet? Close this and give it one try first. A wrong first try still helps.¿Todavía no lo intentaron? Ciérrenla y hagan un intento primero. Un primer intento equivocado también ayuda.
3
Why:Por qué:The value 2 appears 3 times, so 3 dots go above the number 2.El valor 2 aparece 3 veces, así que 3 puntos van sobre el número 2.
Set 1: Build ConfidenceSerie 1: Desarrollar confianza
MULTIPLE CHOICEOPCIÓN MÚLTIPLE
Need a hint?¿Quieres una pista?
Add the number of dots in all the stacks.
Suma los puntos de todas las pilas.
Each dot is one student. What operation puts the stacks together?
Cada punto es un estudiante. ¿Qué operación junta las pilas?
Make one try first. Hint 3 opens after your first answer.Haz un intento primero. La pista 3 se abre después de tu primera respuesta.
Each dot is one student, so add the stacks: 2 + 4 + 3 = 9.
Cada punto es un estudiante, así que suma las pilas: 2 + 4 + 3 = 9.
A dot plot has stacks of 2, 4, and 3 dots. How many students answered?Un diagrama de puntos tiene pilas de 2, 4 y 3 puntos. ¿Cuántos estudiantes respondieron?
✏️ Workspace: draw, type, or get a guided start✏️ Espacio de trabajo: dibuja, escribe o empieza con guía● saved● guardado
✏️ Draw your model: Each dot is one student. What operation puts the stacks together?✏️ Dibuja tu modelo: Cada punto es un estudiante. ¿Qué operación junta las pilas?
🔑Show the answerVer la respuesta
Answer key for families — compare, then talk about why.Clave de respuestas para la familia — comparen y hablen del porqué.
Not tried yet? Close this and give it one try first. A wrong first try still helps.¿Todavía no lo intentaron? Ciérrenla y hagan un intento primero. Un primer intento equivocado también ayuda.
9
Why:Por qué:Each dot is one student, so add the stacks: 2 + 4 + 3 = 9.Cada punto es un estudiante, así que suma las pilas: 2 + 4 + 3 = 9.
Set 1: Build ConfidenceSerie 1: Desarrollar confianza
MULTIPLE CHOICEOPCIÓN MÚLTIPLE
Need a hint?¿Quieres una pista?
The number line should reach both ends of the data.
La recta numérica debe llegar a los dos extremos de los datos.
What are the least and greatest values?
¿Cuáles son el valor menor y el mayor?
Make one try first. Hint 3 opens after your first answer.Haz un intento primero. La pista 3 se abre después de tu primera respuesta.
The line must cover the least (3) to the greatest (8) value, with every whole number labeled: From 3 to 8, with every whole number labeled.
La recta debe cubrir del valor menor (3) al mayor (8), con cada número entero rotulado: De 3 a 8, con cada número entero rotulado.
The data are 3, 5, 5, 8. Which number line is the best start for a dot plot?Los datos son 3, 5, 5, 8. ¿Cuál recta numérica es el mejor comienzo para un diagrama de puntos?
✏️ Workspace: draw, type, or get a guided start✏️ Espacio de trabajo: dibuja, escribe o empieza con guía● saved● guardado
✏️ Draw your model: What are the least and greatest values?✏️ Dibuja tu modelo: ¿Cuáles son el valor menor y el mayor?
🔑Show the answerVer la respuesta
Answer key for families — compare, then talk about why.Clave de respuestas para la familia — comparen y hablen del porqué.
Not tried yet? Close this and give it one try first. A wrong first try still helps.¿Todavía no lo intentaron? Ciérrenla y hagan un intento primero. Un primer intento equivocado también ayuda.
From 3 to 8, with every whole number labeledDe 3 a 8, con cada número entero rotulado
Why:Por qué:The line must cover the least (3) to the greatest (8) value, with every whole number labeled: From 3 to 8, with every whole number labeled.La recta debe cubrir del valor menor (3) al mayor (8), con cada número entero rotulado: De 3 a 8, con cada número entero rotulado.
Set 1: Build ConfidenceSerie 1: Desarrollar confianza
MULTIPLE CHOICEOPCIÓN MÚLTIPLE
Need a hint?¿Quieres una pista?
If the two sides look like mirror images, what do we call it?
Si los dos lados parecen reflejos, ¿cómo se llama?
Compare the left side to the right side of the tallest stack.
Compara el lado izquierdo con el derecho de la pila más alta.
Make one try first. Hint 3 opens after your first answer.Haz un intento primero. La pista 3 se abre después de tu primera respuesta.
When both sides of the peak match, the shape is nearly symmetric. So the answer is: Nearly symmetric.
Cuando los dos lados de la cima se parecen, la forma es casi simétrica. Entonces la respuesta es: Casi simétrica.
The dots have about the same number on each side of the peak. Which word describes the shape?Los puntos están casi igual a cada lado de la cima. ¿Qué palabra describe la forma?
✏️ Workspace: draw, type, or get a guided start✏️ Espacio de trabajo: dibuja, escribe o empieza con guía● saved● guardado
✏️ Draw your model: Compare the left side to the right side of the tallest stack.✏️ Dibuja tu modelo: Compara el lado izquierdo con el derecho de la pila más alta.
🔑Show the answerVer la respuesta
Answer key for families — compare, then talk about why.Clave de respuestas para la familia — comparen y hablen del porqué.
Not tried yet? Close this and give it one try first. A wrong first try still helps.¿Todavía no lo intentaron? Ciérrenla y hagan un intento primero. Un primer intento equivocado también ayuda.
Nearly symmetricCasi simétrica
Why:Por qué:When both sides of the peak match, the shape is nearly symmetric. So the answer is: Nearly symmetric.Cuando los dos lados de la cima se parecen, la forma es casi simétrica. Entonces la respuesta es: Casi simétrica.
Easier problems to practice the idea. Do these first together.Problemas más fáciles para practicar la idea. Hagan estos primero juntos.
💬 Parent Coach:Guía para familias:Ask: "What do you notice first about this problem? Can you draw or write the first step?"Pregunta: "¿Qué notas primero sobre este problema? ¿Puedes dibujar o escribir el primer paso?"
Set 2: Apply ItSerie 2: Aplicarlo 1
MULTIPLE CHOICEOPCIÓN MÚLTIPLE
Need a hint?¿Quieres una pista?
Which way does the thin tail stretch — toward 0 or toward 4?
¿Hacia dónde se estira la cola delgada — hacia el 0 o hacia el 4?
The skew is named after the direction the TAIL points, not where the pile sits.
El sesgo se nombra por la dirección de la COLA, no por dónde está el montón.
Make one try first. Hint 3 opens after your first answer.Haz un intento primero. La pista 3 se abre después de tu primera respuesta.
The tail stretches toward the greater values (3 and 4), so the data is skewed right. Naming it by where most dots pile up is the classic reversal; a peak alone does not make data symmetric; and 2 is the peak, not a gap.
La cola se estira hacia los valores mayores (3 y 4), así que los datos están sesgados a la derecha. Nombrarlo por dónde se amontonan los puntos es la inversión clásica; un pico solo no hace simétricos los datos; y el 2 es el pico, no un hueco.
Ten students said how many siblings they have: 0, 1, 1, 1, 2, 2, 2, 2, 3, 4. The dot plot has its tallest stack at 2, then a short tail stretching to the right toward 4. Which sentence describes this shape correctly?Diez estudiantes dijeron cuántos hermanos tienen: 0, 1, 1, 1, 2, 2, 2, 2, 3, 4. El diagrama de puntos tiene su pila más alta en el 2 y una cola corta que se estira a la derecha hacia el 4. ¿Qué oración describe bien esta forma?
✏️ Workspace: draw, type, or get a guided start✏️ Espacio de trabajo: dibuja, escribe o empieza con guía● saved● guardado
✏️ Draw your model: The skew is named after the direction the TAIL points, not where the pile sits.✏️ Dibuja tu modelo: El sesgo se nombra por la dirección de la COLA, no por dónde está el montón.
🔑Show the answerVer la respuesta
Answer key for families — compare, then talk about why.Clave de respuestas para la familia — comparen y hablen del porqué.
Not tried yet? Close this and give it one try first. A wrong first try still helps.¿Todavía no lo intentaron? Ciérrenla y hagan un intento primero. Un primer intento equivocado también ayuda.
The data is skewed right because the tail points toward the greater values.Los datos están sesgados a la derecha porque la cola apunta hacia los valores mayores.
Why:Por qué:The tail stretches toward the greater values (3 and 4), so the data is skewed right. Naming it by where most dots pile up is the classic reversal; a peak alone does not make data symmetric; and 2 is the peak, not a gap.La cola se estira hacia los valores mayores (3 y 4), así que los datos están sesgados a la derecha. Nombrarlo por dónde se amontonan los puntos es la inversión clásica; un pico solo no hace simétricos los datos; y el 2 es el pico, no un hueco.
Set 2: Apply ItSerie 2: Aplicarlo 2
MULTIPLE CHOICEOPCIÓN MÚLTIPLE
Need a hint?¿Quieres una pista?
Matching sides means a mirror image.
Lados que coinciden significan una imagen de espejo.
Imagine folding the plot at the peak. Do the two sides land on each other?
Imagina doblar el diagrama por el pico. ¿Los dos lados caen uno sobre el otro?
Make one try first. Hint 3 opens after your first answer.Haz un intento primero. La pista 3 se abre después de tu primera respuesta.
When the stacks on the left of the peak mirror the stacks on the right, the distribution is symmetric. Skewed left or skewed right would need one side to trail off longer than the other, and every dot plot has a shape.
Cuando las pilas a la izquierda del pico son el espejo de las de la derecha, la distribución es simétrica. Sesgada a la izquierda o a la derecha necesitaría que un lado se alargue más que el otro, y todo diagrama de puntos tiene una forma.
A dot plot has a tall stack in the middle and shorter stacks that match on both sides. How would you describe its shape?Un diagrama de puntos tiene una pila alta en el medio y pilas más cortas que coinciden a ambos lados. ¿Cómo describirías su forma?
✏️ Workspace: draw, type, or get a guided start✏️ Espacio de trabajo: dibuja, escribe o empieza con guía● saved● guardado
✏️ Draw your model: Imagine folding the plot at the peak. Do the two sides land on each other?✏️ Dibuja tu modelo: Imagina doblar el diagrama por el pico. ¿Los dos lados caen uno sobre el otro?
🔑Show the answerVer la respuesta
Answer key for families — compare, then talk about why.Clave de respuestas para la familia — comparen y hablen del porqué.
Not tried yet? Close this and give it one try first. A wrong first try still helps.¿Todavía no lo intentaron? Ciérrenla y hagan un intento primero. Un primer intento equivocado también ayuda.
symmetricsimétrica
Why:Por qué:When the stacks on the left of the peak mirror the stacks on the right, the distribution is symmetric. Skewed left or skewed right would need one side to trail off longer than the other, and every dot plot has a shape.Cuando las pilas a la izquierda del pico son el espejo de las de la derecha, la distribución es simétrica. Sesgada a la izquierda o a la derecha necesitaría que un lado se alargue más que el otro, y todo diagrama de puntos tiene una forma.
Set 2: Apply ItSerie 2: Aplicarlo 3
MULTIPLE CHOICEOPCIÓN MÚLTIPLE
Need a hint?¿Quieres una pista?
The greatest value is the rightmost value that has a dot.
El valor mayor es el valor más a la derecha que tiene un punto.
The least value is the leftmost value that HAS a dot.
El valor menor es el valor más a la izquierda que TIENE un punto.
Make one try first. Hint 3 opens after your first answer.Haz un intento primero. La pista 3 se abre después de tu primera respuesta.
The data runs from the first value with a dot (6) to the last value with a dot (10). Labels on the number line with no dots above them, like 5 and 11, are not part of the data, and 0 is only where the line might start.
Los datos van desde el primer valor con punto (6) hasta el último valor con punto (10). Las etiquetas de la recta sin puntos encima, como 5 y 11, no son parte de los datos, y 0 es solo donde podría empezar la recta.
A dot plot of quiz scores has dots above 6, 7, 8, 9 and 10, but none above 5 and none above 11. What are the least and greatest values in the data?Un diagrama de puntos de calificaciones tiene puntos sobre 6, 7, 8, 9 y 10, pero ninguno sobre 5 ni sobre 11. ¿Cuáles son el valor menor y el mayor de los datos?
✏️ Workspace: draw, type, or get a guided start✏️ Espacio de trabajo: dibuja, escribe o empieza con guía● saved● guardado
✏️ Draw your model: The least value is the leftmost value that HAS a dot.✏️ Dibuja tu modelo: El valor menor es el valor más a la izquierda que TIENE un punto.
🔑Show the answerVer la respuesta
Answer key for families — compare, then talk about why.Clave de respuestas para la familia — comparen y hablen del porqué.
Not tried yet? Close this and give it one try first. A wrong first try still helps.¿Todavía no lo intentaron? Ciérrenla y hagan un intento primero. Un primer intento equivocado también ayuda.
least 6, greatest 10menor 6, mayor 10
Why:Por qué:The data runs from the first value with a dot (6) to the last value with a dot (10). Labels on the number line with no dots above them, like 5 and 11, are not part of the data, and 0 is only where the line might start.Los datos van desde el primer valor con punto (6) hasta el último valor con punto (10). Las etiquetas de la recta sin puntos encima, como 5 y 11, no son parte de los datos, y 0 es solo donde podría empezar la recta.
3
🚀 Level up — a little harder🚀 Sube de nivel — un poco más difícil
Try these once the warm-up feels easy. It's okay to use the steps and pictures.Intenten estos cuando el calentamiento sea fácil. Está bien usar los pasos y los dibujos.
Set 3: Think DeeperSerie 3: Pensar más profundo 1
OPEN RESPONSERESPUESTA ABIERTA
Need a hint?¿Quieres una pista?
A gap is a value between the least and greatest with NO dots above it.
Un hueco es un valor entre el menor y el mayor SIN puntos encima.
Count how many times each value appears before deciding anything.
Cuenta cuántas veces aparece cada valor antes de decidir algo.
Make one try first. Hint 3 opens after your first answer.Haz un intento primero. La pista 3 se abre después de tu primera respuesta.
The peak is 1 (three dots). The least value is 0 and the greatest is 6. There is a gap at 4 and 5 — no student answered those. The single dot at 6 makes a long thin tail to the right, so the shape is skewed right; the tail points toward the greater values, which is how the direction is named.
El pico es 1 (tres puntos). El valor menor es 0 y el mayor es 6. Hay un hueco en 4 y 5 — ningún estudiante respondió eso. El único punto en 6 forma una cola larga y delgada a la derecha, así que la forma está sesgada a la derecha; la cola apunta hacia los valores mayores, y así se nombra la dirección.
Eight students said how many pets they have: 1, 0, 2, 1, 3, 1, 0, 6. Describe the dot plot in words: where is the peak, what are the least and greatest values, is there a gap, and is the shape symmetric or skewed? Explain how you know the direction of the skew.Ocho estudiantes dijeron cuántas mascotas tienen: 1, 0, 2, 1, 3, 1, 0, 6. Describe el diagrama de puntos con palabras: ¿dónde está el pico, cuáles son el valor menor y el mayor, hay un hueco, y la forma es simétrica o sesgada? Explica cómo sabes la dirección del sesgo.
✏️ Workspace: draw, type, or get a guided start✏️ Espacio de trabajo: dibuja, escribe o empieza con guía● saved● guardado
✏️ Draw your model: Count how many times each value appears before deciding anything.✏️ Dibuja tu modelo: Cuenta cuántas veces aparece cada valor antes de decidir algo.
🔑Show the answerVer la respuesta
Answer key for families — compare, then talk about why.Clave de respuestas para la familia — comparen y hablen del porqué.
Not tried yet? Close this and give it one try first. A wrong first try still helps.¿Todavía no lo intentaron? Ciérrenla y hagan un intento primero. Un primer intento equivocado también ayuda.
Sample answer:Respuesta de ejemplo:The peak is 1 (three dots). The least value is 0 and the greatest is 6. There is a gap at 4 and 5 — no student answered those. The single dot at 6 makes a long thin tail to the right, so the shape is skewed right; the tail points toward the greater values, which is how the direction is named.El pico es 1 (tres puntos). El valor menor es 0 y el mayor es 6. Hay un hueco en 4 y 5 — ningún estudiante respondió eso. El único punto en 6 forma una cola larga y delgada a la derecha, así que la forma está sesgada a la derecha; la cola apunta hacia los valores mayores, y así se nombra la dirección.
Set 3: Think DeeperSerie 3: Pensar más profundo 2
MULTIPLE CHOICEOPCIÓN MÚLTIPLE
Need a hint?¿Quieres una pista?
Count how many times 2 appears in the list.
Cuenta cuántas veces aparece el 2 en la lista.
One dot for every student who answered 2.
Un punto por cada estudiante que respondió 2.
Make one try first. Hint 3 opens after your first answer.Haz un intento primero. La pista 3 se abre después de tu primera respuesta.
The value 2 appears four times, so four dots stack above it. Putting 2 dots (the value itself) or 1 dot confuses the value with its count; 10 is the total number of dots in the whole plot.
El valor 2 aparece cuatro veces, así que se apilan cuatro puntos sobre él. Poner 2 puntos (el valor mismo) o 1 punto confunde el valor con su conteo; 10 es el total de puntos de todo el diagrama.
Ten students said how many siblings they have: 0, 1, 1, 1, 2, 2, 2, 2, 3, 4. In a dot plot of this data, how many dots go above the 2?Diez estudiantes dijeron cuántos hermanos tienen: 0, 1, 1, 1, 2, 2, 2, 2, 3, 4. En un diagrama de puntos de estos datos, ¿cuántos puntos van sobre el 2?
✏️ Workspace: draw, type, or get a guided start✏️ Espacio de trabajo: dibuja, escribe o empieza con guía● saved● guardado
✏️ Draw your model: One dot for every student who answered 2.✏️ Dibuja tu modelo: Un punto por cada estudiante que respondió 2.
🔑Show the answerVer la respuesta
Answer key for families — compare, then talk about why.Clave de respuestas para la familia — comparen y hablen del porqué.
Not tried yet? Close this and give it one try first. A wrong first try still helps.¿Todavía no lo intentaron? Ciérrenla y hagan un intento primero. Un primer intento equivocado también ayuda.
4
Why:Por qué:The value 2 appears four times, so four dots stack above it. Putting 2 dots (the value itself) or 1 dot confuses the value with its count; 10 is the total number of dots in the whole plot.El valor 2 aparece cuatro veces, así que se apilan cuatro puntos sobre él. Poner 2 puntos (el valor mismo) o 1 punto confunde el valor con su conteo; 10 es el total de puntos de todo el diagrama.
Set 3: Think DeeperSerie 3: Pensar más profundo 3
MULTIPLE CHOICEOPCIÓN MÚLTIPLE
Need a hint?¿Quieres una pista?
Count each value: how many 0s, 1s, 2s, 3s, 4s?
Cuenta cada valor: ¿cuántos 0, 1, 2, 3, 4 hay?
The peak is the value with the TALLEST stack of dots.
El pico es el valor con la pila de puntos MÁS ALTA.
Make one try first. Hint 3 opens after your first answer.Haz un intento primero. La pista 3 se abre después de tu primera respuesta.
Counting the list, 2 appears five times, so the tallest stack is above 2. The peak is the VALUE with the most dots, not the height of that stack (5), not the greatest value on the line (4), and not the number of students (12).
Al contar la lista, el 2 aparece cinco veces, así que la pila más alta está sobre el 2. El pico es el VALOR con más puntos, no la altura de esa pila (5), ni el valor mayor de la recta (4), ni el número de estudiantes (12).
Twelve students named how many books they finished: 0, 2, 1, 2, 3, 2, 4, 1, 2, 3, 0, 2. Which value is the peak of the dot plot — the most common answer?Doce estudiantes dijeron cuántos libros terminaron: 0, 2, 1, 2, 3, 2, 4, 1, 2, 3, 0, 2. ¿Qué valor es el pico del diagrama de puntos — la respuesta más común?
✏️ Workspace: draw, type, or get a guided start✏️ Espacio de trabajo: dibuja, escribe o empieza con guía● saved● guardado
✏️ Draw your model: The peak is the value with the TALLEST stack of dots.✏️ Dibuja tu modelo: El pico es el valor con la pila de puntos MÁS ALTA.
🔑Show the answerVer la respuesta
Answer key for families — compare, then talk about why.Clave de respuestas para la familia — comparen y hablen del porqué.
Not tried yet? Close this and give it one try first. A wrong first try still helps.¿Todavía no lo intentaron? Ciérrenla y hagan un intento primero. Un primer intento equivocado también ayuda.
2
Why:Por qué:Counting the list, 2 appears five times, so the tallest stack is above 2. The peak is the VALUE with the most dots, not the height of that stack (5), not the greatest value on the line (4), and not the number of students (12).Al contar la lista, el 2 aparece cinco veces, así que la pila más alta está sobre el 2. El pico es el VALOR con más puntos, no la altura de esa pila (5), ni el valor mayor de la recta (4), ni el número de estudiantes (12).
Step 4 of 5Paso 4 de 5
Check & ImproveRevisa y mejora
See what each answer shows. Fix one, then try a fresh one.Vean qué muestra cada respuesta. Corrijan una y prueben una nueva.
Finish Your Turn first. Then this page shows what each answer tells us.Primero terminen Tu turno. Luego esta página muestra qué nos dice cada respuesta.
Step 5 of 5Paso 5 de 5
FinishTerminar
Celebrate what you did, see what it showed, then take one next step or stop here.Celebren lo que hicieron, vean lo que mostró y den un siguiente paso o paren aquí.
What happened todayLo que pasó hoy
Saved only on this device. Your teacher has not received it.Se guarda solo en este dispositivo. Su maestro o maestra no lo ha recibido.
Certificate, photo, sign-off and badges (optional)Certificado, foto, firma e insignias (opcional)
🎉Finished for todayTerminaste por hoy
The last stepEl último paso
Teach it to someoneEnséñaselo a alguien
Pick one problem you solved.Elige un problema que resolviste.
Explain it out loud. Use any language first.Explícalo en voz alta. Usa primero el idioma que prefieras.
Say it again with the English math words:Dilo otra vez con las palabras de matemáticas en inglés:
Dot plot · Diagrama de puntos
Data · Datos
Peak · Pico
Your partner asks: “How do you know?” Answer with: “I got ___ because ___. I checked by ___.”Tu acompañante pregunta: “¿Cómo lo sabes?” Responde: “Obtuve ___ porque ___. Comprobé usando ___.”
How sure do you feel now?¿Qué tan seguro o segura te sientes ahora?
Compare it with how you felt at the start.Compáralo con cómo te sentías al empezar.
Our family math nightsNuestras noches de matemáticas en familia
Weekends never break it. Saved only on this device.Los fines de semana no la interrumpen. Se guarda solo en este dispositivo.
Name one strategy that helped, or one question to ask next time. You can stop here; no adult signature is needed.
Di una estrategia que te ayudó o una pregunta para la próxima vez. Puedes terminar aquí; no necesitas la firma de un adulto.
Answers save automatically on this device. Tap Check This Problem anytime.Las respuestas se guardan solas en este dispositivo. Toquen Revisar esta pregunta cuando quieran.
Shares only the lesson name and a link. No answers, no names.Comparte solo el nombre de la lección y un enlace. Sin respuestas ni nombres.
Sign in to your family account, open Messages, and choose Mr. Neft. Include this lesson number and your question.Inicien sesión con su cuenta familiar, abran Mensajes y elijan al Sr. Neft. Incluyan el número de esta lección y su pregunta.
Want to do more?¿Quieren hacer más?
These extras are not required. Photos, recordings and reflections stay on this device. To send anything to Mr. Neft, use ClassDojo.Estos extras no son obligatorios. Las fotos, grabaciones y reflexiones quedan en este dispositivo. Para enviar algo al Sr. Neft, usa ClassDojo.
Reflection, voice memo and badgesReflexión, nota de voz e insignias
🎙️My Math Voice · Private Local ReflectionMi Voz Matemática · Reflexión Privada en este Dispositivo
0:00
🏆
Reflection saved on this deviceReflexión guardada en este dispositivo
Saved on:Guardado el:
🔥 1-Night StreakRacha de 1 noche
Question draft (not sent):Borrador de pregunta (no enviado):
Family reflection:Reflexión familiar:
Student Work Photo:Foto del trabajo:
Student Voice Memo:Nota de voz del estudiante:
📖Concept ExplorerExplorador
📚Vocab ChampCamp. Vocabulario
⭐3-Star HeroHéroe 3 Estrellas
🎮Game MasterMaestro del Juego
🔥Family StreakRacha Familiar
🏡Home ExplorerExplorador del Hogar
EDU WONDERLAB MATH
Family Math Practice Record
A personal record of practice for . Saved on this device; not submitted to the teacher.
Practice partner (optional)
Date
Question draft (not sent):
💬 Family Conversation Card
Ask at the table
Which answer has the tallest stack, and what does that tell us about the group?
Try it together
Ask 8 people (or make up 8 answers): "How many cups of water did you drink yesterday?" Draw a number line and put one dot above the number for each answer, stacking dots that match. Circle the tallest stack and say if the dots look nearly symmetric.
To start talking
The tallest stack is above ___, so ___ is the most common answer. The dots look ___.
💬 Tarjeta de conversación familiar
Pregunten en la mesa
¿Qué respuesta tiene la pila más alta y qué nos dice del grupo?
Prueben juntos
Pregunten a 8 personas (o inventen 8 respuestas): "¿Cuántos vasos de agua tomaste ayer?" Dibujen una recta numérica y pongan un punto sobre el número de cada respuesta, apilando los puntos iguales. Encierren la pila más alta y digan si los puntos parecen casi simétricos.
Para empezar a hablar
La pila más alta está sobre ___, así que ___ es la respuesta más común. Los puntos se ven ___.
Talk it throughConversen sobre esto
Which answer has the tallest stack, and what does that tell us about the group?¿Qué respuesta tiene la pila más alta y qué nos dice del grupo?
Start your answer like this:Empiecen su respuesta así:The tallest stack is above ___, so ___ is the most common answer. The dots look ___.La pila más alta está sobre ___, así que ___ es la respuesta más común. Los puntos se ven ___.
A strong answer sounds like:Una respuesta sólida suena así:In class we draw a number line from 0 to 4 and stack one dot for each student. The tallest stack, above 2, is the peak.En clase dibujamos una recta numérica del 0 al 4 y apilamos un punto por cada estudiante. La pila más alta, sobre el 2, es el pico.
No grown-up nearby? Say your answer out loud to yourself, then write one sentence that proves it. Either language is fine.¿No hay un adulto cerca? Di tu respuesta en voz alta y escribe una oración que la pruebe. Sirve cualquiera de los dos idiomas.
⚠️
Watch out:Cuidado con este error común:
Thinking the tallest stack is the greatest value. The tallest stack is the answer that happened most often; the greatest value is the dot farthest right.Pensar que la pila más alta es el valor mayor. La pila más alta es la respuesta que ocurrió más veces; el valor mayor es el punto más a la derecha.
💬 Parent Coach Question:Pregunta de guía:Which answer has the tallest stack, and what does that tell us about the group?¿Qué respuesta tiene la pila más alta y qué nos dice del grupo?
Find the mistakeEncuentra el error
Be the teacher: find the mistakeSé el maestro: encuentra el error
A different situation: Nine students said how many pets they have: 0, 1, 1, 2, 1, 3, 1, 0, 2. Marco draws a dot plot.Otra situación: Nueve estudiantes dijeron cuántas mascotas tienen: 0, 1, 1, 2, 1, 3, 1, 0, 2. Marco dibuja un diagrama de puntos.
Tap the step where the thinking went off track. Then explain why.Toca el paso donde el razonamiento se desvió. Luego explica por qué.
Not yet. Try another look.Todavía no. Intenta otra mirada.
How to fix it:Cómo corregirlo:Every answer gets its own dot. Stack 2 dots above 0, 4 above 1, 2 above 2, and 1 above 3. That is 2 + 4 + 2 + 1 = 9 dots, one for each student.Cada respuesta tiene su propio punto. Apila 2 puntos sobre el 0, 4 sobre el 1, 2 sobre el 2 y 1 sobre el 3. Son 2 + 4 + 2 + 1 = 9 puntos, uno por cada estudiante.
Say it out loud:Dilo en voz alta:Each dot is one ___, so ___ students need ___ dots.Cada punto es una ___, así que ___ estudiantes necesitan ___ puntos.
🔵WHY THIS MATTERS¿POR QUÉ IMPORTA?
Seeing answers at a glanceVer las respuestas de un vistazo
A dot plot lets a class see all its answers on one line. A teacher who asks students how many books they read can spot the most common answer just by finding the tallest stack of dots.Un diagrama de puntos deja que una clase vea todas sus respuestas en una sola recta. Un maestro que pregunta cuántos libros leyeron los estudiantes puede ver la respuesta más común solo con buscar la pila de puntos más alta.
Try it at homePruébenlo en casa
Ask 8 people (or make up 8 answers): "How many cups of water did you drink yesterday?" Draw a number line and put one dot above the number for each answer, stacking dots that match. Circle the tallest stack and say if the dots look nearly symmetric.Pregunten a 8 personas (o inventen 8 respuestas): "¿Cuántos vasos de agua tomaste ayer?" Dibujen una recta numérica y pongan un punto sobre el número de cada respuesta, apilando los puntos iguales. Encierren la pila más alta y digan si los puntos parecen casi simétricos.
⚡ SKILL POWER-UP · OPTIONALRETO DE PODER · OPCIONAL
Dots at 1, 2, 2, 2, 3, 5 are on a dot plot. Which value is the most common?En un diagrama de puntos hay puntos en 1, 2, 2, 2, 3, 5. ¿Cuál valor es el más común?
★ 1 Star★ 1 Estrella
🔒
Tonight's mystery challengeEl reto misterioso de hoy
Can you crack this before tonight is over?¿Puedes resolver esto antes de terminar hoy?
It is the last problem in Level up. It is the hardest one — and you can do it.Es el último problema de «Sube de nivel». Es el más difícil, y tú puedes resolverlo.
Locked. Finish 10 problems and it opens.Bloqueado. Termina 10 problemas y se abre.
📚Words to knowPalabras clave
1. Tap a card to flip it. 2. Play the quiz. 3. Match the words.1. Toca una tarjeta para voltearla. 2. Haz la prueba. 3. Empareja las palabras.
Dot plotDiagrama de puntos
Diagrama de puntos
💡 One dot for each answer, stacked above its value on the line.
DEFINITIONDEFINICIÓN
Dot plotDiagrama de puntos
Diagrama de puntos
A number line with one dot for each value.
ES Una recta numérica con un punto por cada valor.
📌One dot for each answer, stacked above its value on the line.
DataDatos
Datos
💡 Player heights: 60 in, 63 in, 58 in, 65 in — four different measurements
DEFINITIONDEFINICIÓN
DataDatos
Datos
Facts and numbers you collect.
ES Información y números que reúnes, como respuestas de una encuesta.
📌Player heights: 60 in, 63 in, 58 in, 65 in — four different measurements
PeakPico
Pico
💡 The tallest bar of the histogram is the peak.
DEFINITIONDEFINICIÓN
PeakPico
Pico
The tallest bar or stack of dots.
ES La barra o pila de puntos más alta.
📌The tallest bar of the histogram is the peak.
symmetricsimétrico
simétrico
💡 Bars of height 2, 4, 2: both sides of the peak match.
DEFINITIONDEFINICIÓN
symmetricsimétrico
simétrico
Both halves match, like a mirror.
ES Las dos mitades coinciden, como en un espejo.
📌Bars of height 2, 4, 2: both sides of the peak match.
Data distributionDistribución de datos
Distribución de datos
💡 A distribution is symmetric when its left and right sides have approximately matching shapes around the center.
DEFINITIONDEFINICIÓN
Data distributionDistribución de datos
Distribución de datos
Where the values sit and how far apart they are.
ES Dónde están los valores y qué tan separados están.
📌A distribution is symmetric when its left and right sides have approximately matching shapes around the center.
🎯Word QuizPrueba de palabras
Which word fits?¿Qué palabra encaja?
🎉 Quiz done!¡Prueba terminada!
First-try stars:Estrellas al primer intento:
⚡
Match the WordsEmpareja las palabras
Tap a word on the left, then tap its matching definition on the right!¡Toca una palabra a la izquierda y su significado a la derecha!
Matched: Emparejadas: 0 / 5
🎉
Vocab Master! All 5 words matched!¡Maestro del Vocabulario! ¡Todas las palabras emparejadas!
Great job connecting the math vocabulary. Explore the flashcards below!Excelente conectando el vocabulario. ¡Exploren las tarjetas abajo!
🎮PlayJugar
Pick a game and play as a team. Nothing here is timed, and every game can be replayed as many times as you like.Escojan un juego y jueguen en equipo. Nada aquí tiene cronómetro, y pueden repetir cada juego cuantas veces quieran.
🏡 FAMILY ACTIVITY CORNERRINCÓN DE ACTIVIDADES
Try the recommended mission. Student: explain; partner: ask one question, then switch. Paper drawings work for every object.Prueba la misión recomendada. Estudiante: explica; acompañante: haz una pregunta, luego cambien. Puedes dibujar los objetos en papel.
One mission is enough. You can also work solo and explain in writing.Una misión es suficiente. También puedes trabajar a solas y explicar por escrito.
🏡Use the math at homeUsa las matemáticas en casa⏱️ ~5 min🧰 Paper and pencil; real objects are optional🧰 Papel y lápiz; los objetos reales son opcionales▾
1
Ask 8 people (or make up 8 answers): "How many cups of water did you drink yesterday?" Draw a number line and put one dot above the number for each answer, stacking dots that match. Circle the tallest stack and say if the dots look nearly symmetric.
Pregunten a 8 personas (o inventen 8 respuestas): "¿Cuántos vasos de agua tomaste ayer?" Dibujen una recta numérica y pongan un punto sobre el número de cada respuesta, apilando los puntos iguales. Encierren la pila más alta y digan si los puntos parecen casi simétricos.
2
Show a labeled drawing, table, or equation. Your partner asks one question; working alone, write your explanation.
Muestra un dibujo con etiquetas, una tabla o una ecuación. Tu acompañante hace una pregunta; a solas, escribe tu explicación.
💬 Talk about it:Para conversar:Which answer has the tallest stack, and what does that tell us about the group?¿Qué respuesta tiene la pila más alta y qué nos dice del grupo?
🎮 FAMILY ARCADESALA DE JUEGOS EN FAMILIA
Choose ONE game. Quick Quiz practices this lesson; the other games review related skills. Play together or solo, without a timer.Elige UN juego. Reto rápido practica esta lección; los demás repasan temas relacionados. Juega acompañado o a solas, sin cronómetro.
🧩Math Dominoes: Build the ChainDominó matemático: arma la cadena
Build a chain. The left side of each domino is the match for the problem on the end of the chain. Tap the domino that fits next.Armen una cadena. El lado izquierdo de cada ficha es la pareja del problema al final de la cadena. Toquen la ficha que encaja.
A student and a grown-up share one chain. Take turns placing, and switch coach and player each time. There is no winner and no timer.Un estudiante y un adulto comparten una cadena. Colocan fichas por turnos y cambian de entrenador y jugador cada vez. No hay ganador ni cronómetro.
💬Tap for coaching phrases that praise reasoningToca para ver frases que elogian el razonamiento
“How did you know those two values match?”«¿Cómo supiste que esos dos valores coinciden?»
“I like how you tested that piece before placing it.”«Me gusta cómo probaste esa ficha antes de colocarla.»
🎉 Chain complete! The last problem links back to the first domino: a perfect loop.¡Cadena completa! El último problema conecta con la primera ficha: un círculo perfecto.
🎯True or False? Family Face-Off¿Verdadero o falso? Duelo Familiar
Take turns — student answers one, then a family member answers the next. Watch for the trick statements!Por turnos: el estudiante responde una y luego un familiar responde la siguiente. ¡Cuidado con las trampas!
🗂️Sort It!¡A clasificar!
Tap a card, then tap the bin it belongs in. Talk it through before you tap!Toquen una tarjeta y luego el cesto al que pertenece. ¡Conversen antes de tocar!
🤔Would You Rather?¿Qué prefieres?
Everyone votes and says WHY. Then tap to see what the math says — sometimes it is a tie!Todos votan y dicen POR QUÉ. Luego toquen para ver qué dicen las matemáticas: ¡a veces es empate!
OR
🔎 What the math saysLo que dicen las matemáticas
⚡Quick QuizReto rápido
Reinforce tonight's topic with a quick family game. You ask; your student decides!Refuercen el tema de hoy con un juego rápido en familia. ¡Ustedes preguntan; su estudiante decide!
Stat Sort! ¡Estadística!
🎮 Play together! Statistical questions expect many different answers from a group.🎮 ¡Jueguen juntos! Las preguntas estadísticas esperan muchas respuestas diferentes de un grupo.
The bigger review game for tonight's lesson — sort, match and choose. A wrong answer gives a hint and lets your student try again. No timer.El juego de repaso más grande para la lección de hoy — clasificar, emparejar y elegir. Si se equivocan, reciben una pista y lo intentan otra vez. Sin cronómetro.
📸 MATH WORK PHOTOBOOTHCABINA DE FOTOS DEL TRABAJO DE MATEMÁTICAS
Celebrate & Snap Your Math Work!¡Celebra y toma foto de tu trabajo matemático!
Use this as a photobooth for the work itself: point the camera at tonight's notebook page, the scratchpad or the whiteboard and take the picture — or pose holding it up. Choose a frame, add stickers, then download it, print it, or add it to your optional reflection. The photo is never uploaded; it stays on this device.Úsenla como cabina de fotos del trabajo: apunten la cámara a la página del cuaderno, al borrador o a la pizarra y tomen la foto, o posen sosteniéndola. Elijan un marco, agreguen calcomanías y luego descárguenla, imprímanla o agréguenla a la reflexión opcional. La foto nunca se sube a internet; se queda en este dispositivo.
🏆 MATH CHAMPIONCAMPEÓN DE MATESLesson 2-1 · Session 2
3
📸
Camera Ready!¡Cámara lista!
Tap “Start Camera” to photograph tonight’s work, or use “Upload Work” below. The photo stays on this device.Toca “Iniciar Cámara” para fotografiar el trabajo de hoy, o usa “Subir Foto”. La foto se queda en este dispositivo.
Holding your open notebook or paper up next to your smile makes the best shot! You can also snap a photo of just your written work.¡Sostener el cuaderno abierto junto a su sonrisa crea la mejor foto! También pueden tomar la foto solo de su trabajo escrito.
If your student gets stuck · Help My ChildSi se atoran · Ayudar a mi hijo/a
💬If your student gets stuckSi se atora
✅What to sayQué decir
What does one dot on this plot stand for?
¿Qué representa un punto en este diagrama?
Which stack is tallest? What does that tell us?
¿Cuál pila es la más alta? ¿Qué nos dice eso?
Do the two sides of the peak look about the same?
¿Los dos lados del pico se ven casi iguales?
🚫What NOT to sayQué evitar
One dot can stand for two or three students to save space.
Un punto puede representar dos o tres estudiantes para ahorrar espacio.
Skip the values that nobody chose, do not label them.
Salta los valores que nadie eligió, no los marques.
Any plot with a tall middle is symmetric.
Cualquier diagrama con un centro alto es simétrico.
Struggle is part of learning. Short breaks and snacks are allowed!La dificultad es parte del aprendizaje. ¡Descansos y meriendas están permitidos!
These links go to specific videos about tonight's topic — not general math pages.Estos enlaces van a videos específicos sobre el tema de hoy — no a páginas generales.
EduWonderLab Mathematics · Grade 6 Family Learning Companion 3.0
Lesson 2-1 · Session 2: Dot Plots and Shape
🏠 1-Page Refrigerator Sheet & Dinner TalkHoja Familiar de 1 Página y Charla en Casa
Scan for interactive practice & gamesEscanea para jugar
🎯The Big Idea & Visual ModelLa idea principal y modelo visual
In one sentence:En una frase: A dot plot is a number line with one dot for every single answer. Stacking the dots makes the answers easy to read at a glance: the tallest stack is the most common answer, and the two ends show the least and the greatest.
En una frase: Un diagrama de puntos es una recta numérica con un punto por cada respuesta. Apilar los puntos hace que las respuestas se lean de un vistazo: la pila más alta es la respuesta más común, y los dos extremos muestran el menor y el mayor.
🍽️Tonight's 60-Second Math TalkCharla Matemática de 60 Segundos
Ask your student:Pregúntale a tu estudiante:“Which answer has the tallest stack, and what does that tell us about the group?”«¿Qué respuesta tiene la pila más alta y qué nos dice del grupo?»
👀 Listen for "dot plot" (diagrama de puntos) — one dot equals one answer, never a group of answers. Escuchen "diagrama de puntos" — un punto es una respuesta, nunca un grupo de respuestas.
🔺 Listen for "symmetric" (simétrico) — it means the two sides of the plot look about the same around the tallest stack. Escuchen "simétrico" — significa que los dos lados del diagrama se ven casi iguales alrededor de la pila más alta.
✏️Quick Paper PracticePráctica rápida en papel
#1: Ten students said how many siblings they have: 0, 1, 1, 1, 2, 2, 2, 2, 3, 4. In a dot plot of this data, how many dots go above the 2?
Student Work & Thinking:Espacio de trabajo del estudiante:
#2: Twelve students named how many books they finished: 0, 2, 1, 2, 3, 2, 4, 1, 2, 3, 0, 2. Which value is the peak of the dot plot — the most common answer?
Student Work & Thinking:Espacio de trabajo del estudiante:
✂️ Tear-off check-in ticket or keep on refrigeratorBoleto desprendible o para el refrigerador🌟 I talked math with someone at home tonight!¡Hoy hablé de matemáticas con alguien en casa!
Student:Estudiante: ______________________Practice partner (optional):Acompañante de práctica (opcional): ______________________Date:Fecha: __________
🎨 Student pride note or optional partner sketch / doodle:Nota de orgullo del estudiante o dibujo opcional en familia:
Tonight's math felt:La matemática de hoy se sintió:[ ] 🟢 SmoothBien[ ] 🟡 Needed helpCon ayuda[ ] 🔴 ToughDifícil
Family Math Studio
Lesson 2.1 · Session 26.DS.1
Understand Statistical Questions
Draw every answer as a dot on a number line and describe the shape.
NameDate
Tonight's spark
At the library, twelve students told how many books they finished: 0, 2, 1, 2, 3, 2, 4, 1, 2, 3, 0, 2. Which number of books did the most students say?
Make a guess first: was it 0, 2, or 4 books?
Our class model: one dot for every answer
Try it
Work it out on paper. Write one answer on each line.
In a dot plot, what does each dot stand for?
A. One answer from the data
B. The total of all the answers
C. The name of a group
D. The tallest stack
My answer
Data: 1, 2, 2, 2, 4. How many dots go above the number 2?
A. 1
B. 2
C. 3
D. 5
My answer
The tallest stack of dots is above 5. What does that tell you?
A. 5 is the greatest value
B. 5 is the most common answer
C. There are only 5 dots
D. 5 is the middle of the number line
My answer
A dot plot has stacks of 2, 4, and 3 dots. How many students answered?
A. 9
B. 3
C. 4
D. 24
My answer
The data are 3, 5, 5, 8. Which number line is the best start for a dot plot?
A. Only 3, 5, and 8 labeled
B. From 0 to 100 by tens
C. From 3 to 5
D. From 3 to 8, with every whole number labeled
My answer
Talk about it
Which answer has the tallest stack, and what does that tell us about the group?
Home mission
A different situation: Ask each person at home how many glasses of water they drank today. Lay a paper strip numbered 0 to 5 on the table. Use a coin as a dot for each answer, stacked above its number. Which number has the tallest stack?
If we get stuck, ask
What does one dot on this plot stand for?
Which stack is tallest? What does that tell us?
Do the two sides of the peak look about the same?
Family Math Studio
Lección 2.1 · Sesión 26.DS.1
Diagramas de puntos y su forma
Dibujar cada respuesta como un punto en una recta numérica y describir la forma.
NombreFecha
La chispa de hoy
En la biblioteca, doce estudiantes dijeron cuántos libros terminaron: 0, 2, 1, 2, 3, 2, 4, 1, 2, 3, 0, 2. ¿Qué cantidad de libros dijeron más estudiantes?
Primero adivina: ¿fueron 0, 2 o 4 libros?
Nuestro modelo de clase: un punto por cada respuesta
Inténtalo
Resuélvelo en papel. Escribe una respuesta en cada línea.
En un diagrama de puntos, ¿qué representa cada punto?
A. Una respuesta de los datos
B. La suma de todas las respuestas
C. El nombre de un grupo
D. La pila más alta
Mi respuesta
Datos: 1, 2, 2, 2, 4. ¿Cuántos puntos van sobre el número 2?
A. 1
B. 2
C. 3
D. 5
Mi respuesta
La pila de puntos más alta está sobre el 5. ¿Qué te dice eso?
A. 5 es el valor mayor
B. 5 es la respuesta más común
C. Solo hay 5 puntos
D. 5 es el centro de la recta numérica
Mi respuesta
Un diagrama de puntos tiene pilas de 2, 4 y 3 puntos. ¿Cuántos estudiantes respondieron?
A. 9
B. 3
C. 4
D. 24
Mi respuesta
Los datos son 3, 5, 5, 8. ¿Cuál recta numérica es el mejor comienzo para un diagrama de puntos?
A. Solo 3, 5 y 8 rotulados
B. De 0 a 100 de diez en diez
C. De 3 a 5
D. De 3 a 8, con cada número entero rotulado
Mi respuesta
Conversen
¿Qué respuesta tiene la pila más alta y qué nos dice del grupo?
Misión en casa
Otra situación: Pregunten a cada persona de la casa cuántos vasos de agua tomó hoy. Pongan en la mesa una tira de papel numerada del 0 al 5. Usen una moneda como punto para cada respuesta, apilada sobre su número. ¿Cuál número tiene la pila más alta?
Si se atoran, pregunten
¿Qué representa un punto en este diagrama?
¿Cuál pila es la más alta? ¿Qué nos dice eso?
¿Los dos lados del pico se ven casi iguales?
✏️ Sentence starterPara empezar
Answer sheetHoja de respuestas · Dot Plots and Shape
Check the work after trying each problem. Talk about why each answer makes sense.Revisen el trabajo después de intentar cada problema. Hablen de por qué cada respuesta tiene sentido.
Basic practice 1Práctica básica 1
One answer from the dataUna respuesta de los datos
Each dot stands for one answer from the data. So the answer is: One answer from the data.Cada punto representa una respuesta de los datos. Entonces la respuesta es: Una respuesta de los datos.
Basic practice 2Práctica básica 2
5 is the most common answer5 es la respuesta más común
The tallest stack is the answer that happened most often, so 5 is the most common answer.La pila más alta es la respuesta que ocurrió más veces, así que 5 es la respuesta más común.
Basic practice 3Práctica básica 3
4 dots4 puntos
Find every 3 in the list. There are 4, and each one is a dot. Check: 10 answers means 10 dots in all, and 10 − 6 others = 4.Busca cada 3 en la lista. Hay 4, y cada uno es un punto. Comprueba: 10 respuestas son 10 puntos en total, y 10 − 6 de los otros = 4.
Basic practice 4Práctica básica 4
3
The value 2 appears 3 times, so 3 dots go above the number 2.El valor 2 aparece 3 veces, así que 3 puntos van sobre el número 2.
Basic practice 5Práctica básica 5
9
Each dot is one student, so add the stacks: 2 + 4 + 3 = 9.Cada punto es un estudiante, así que suma las pilas: 2 + 4 + 3 = 9.
Basic practice 6Práctica básica 6
From 3 to 8, with every whole number labeledDe 3 a 8, con cada número entero rotulado
The line must cover the least (3) to the greatest (8) value, with every whole number labeled: From 3 to 8, with every whole number labeled.La recta debe cubrir del valor menor (3) al mayor (8), con cada número entero rotulado: De 3 a 8, con cada número entero rotulado.
Basic practice 7Práctica básica 7
Nearly symmetricCasi simétrica
When both sides of the peak match, the shape is nearly symmetric. So the answer is: Nearly symmetric.Cuando los dos lados de la cima se parecen, la forma es casi simétrica. Entonces la respuesta es: Casi simétrica.
Warm-up 1Calentamiento 1
The data is skewed right because the tail points toward the greater values.Los datos están sesgados a la derecha porque la cola apunta hacia los valores mayores.
The tail stretches toward the greater values (3 and 4), so the data is skewed right. Naming it by where most dots pile up is the classic reversal; a peak alone does not make data symmetric; and 2 is the peak, not a gap.La cola se estira hacia los valores mayores (3 y 4), así que los datos están sesgados a la derecha. Nombrarlo por dónde se amontonan los puntos es la inversión clásica; un pico solo no hace simétricos los datos; y el 2 es el pico, no un hueco.
Warm-up 2Calentamiento 2
symmetricsimétrica
When the stacks on the left of the peak mirror the stacks on the right, the distribution is symmetric. Skewed left or skewed right would need one side to trail off longer than the other, and every dot plot has a shape.Cuando las pilas a la izquierda del pico son el espejo de las de la derecha, la distribución es simétrica. Sesgada a la izquierda o a la derecha necesitaría que un lado se alargue más que el otro, y todo diagrama de puntos tiene una forma.
Warm-up 3Calentamiento 3
least 6, greatest 10menor 6, mayor 10
The data runs from the first value with a dot (6) to the last value with a dot (10). Labels on the number line with no dots above them, like 5 and 11, are not part of the data, and 0 is only where the line might start.Los datos van desde el primer valor con punto (6) hasta el último valor con punto (10). Las etiquetas de la recta sin puntos encima, como 5 y 11, no son parte de los datos, y 0 es solo donde podría empezar la recta.
Level up 1Sube de nivel 1
The peak is 1 (three dots). The least value is 0 and the greatest is 6. There is a gap at 4 and 5 — no student answered those. The single dot at 6 makes a long thin tail to the right, so the shape is skewed right; the tail points toward the greater values, which is how the direction is named.El pico es 1 (tres puntos). El valor menor es 0 y el mayor es 6. Hay un hueco en 4 y 5 — ningún estudiante respondió eso. El único punto en 6 forma una cola larga y delgada a la derecha, así que la forma está sesgada a la derecha; la cola apunta hacia los valores mayores, y así se nombra la dirección.
Level up 2Sube de nivel 2
4
The value 2 appears four times, so four dots stack above it. Putting 2 dots (the value itself) or 1 dot confuses the value with its count; 10 is the total number of dots in the whole plot.El valor 2 aparece cuatro veces, así que se apilan cuatro puntos sobre él. Poner 2 puntos (el valor mismo) o 1 punto confunde el valor con su conteo; 10 es el total de puntos de todo el diagrama.
Level up 3Sube de nivel 3
2
Counting the list, 2 appears five times, so the tallest stack is above 2. The peak is the VALUE with the most dots, not the height of that stack (5), not the greatest value on the line (4), and not the number of students (12).Al contar la lista, el 2 aparece cinco veces, así que la pila más alta está sobre el 2. El pico es el VALOR con más puntos, no la altura de esa pila (5), ni el valor mayor de la recta (4), ni el número de estudiantes (12).