- Basic practice 1Práctica básica 1
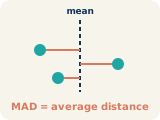
- How far the values are from the mean, on averageQué tan lejos están los valores de la media, en promedio
MAD tells how far the values are from the mean, on average. So the answer is: How far the values are from the mean, on average.La DMA dice qué tan lejos están los valores de la media, en promedio. Entonces la respuesta es: Qué tan lejos están los valores de la media, en promedio.
- Basic practice 2Práctica básica 2
4 + 0 + 2 + 2 = 8 and 8 ÷ 4 = 2.4 + 0 + 2 + 2 = 8 y 8 ÷ 4 = 2.
- Basic practice 3Práctica básica 3
The gaps from 15 are 5, 1, 1 and 5. They add to 12, and 12 ÷ 4 = 3 laps.Las distancias a 15 son 5, 1, 1 y 5. Suman 12, y 12 ÷ 4 = 3 vueltas.
- Basic practice 4Práctica básica 4
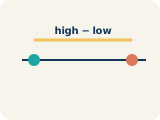
The distance is 14 − 10 = 4.La distancia es 14 − 10 = 4.
- Basic practice 5Práctica básica 5
The distances are 6, 0, 6. Their sum is 12 and 12 ÷ 3 = 4.Las distancias son 6, 0, 6. Su suma es 12 y 12 ÷ 3 = 4.
- Basic practice 6Práctica básica 6
The distances are 3, 3, 1, 5. Their sum is 12 and 12 ÷ 4 = 3.Las distancias son 3, 3, 1, 5. Su suma es 12 y 12 ÷ 4 = 3.
- Basic practice 7Práctica básica 7
The values 20, 21, 22 sit close to their mean, so they have the smaller MAD.Los valores 20, 21, 22 están cerca de su media, así que tienen la DMA menor.
- Warm-up 1Calentamiento 1
- Bench: 8, 10, 12, 14 → MAD = 2 pointsBanca: 8, 10, 12, 14 → DAM = 2 puntos
- Rookie: 4, 4, 4, 4 → MAD = 0 pointsNovato: 4, 4, 4, 4 → DAM = 0 puntos
- Starter: 5, 15, 5, 15 → MAD = 5 pointsTitular: 5, 15, 5, 15 → DAM = 5 puntos
Find each player's mean, then average the distances. Bench (8, 10, 12, 14) has a mean of 11 and distances 3, 1, 1, 3, so MAD = 8 ÷ 4 = 2 points. Rookie (4, 4, 4, 4) has a mean of 4 and every distance is 0, so MAD = 0 points. Starter (5, 15, 5, 15) has a mean of 10 and every distance is 5, so MAD = 5 points — the widest swing of the three.Encuentra la media de cada jugador y luego promedia las distancias. Bench (8, 10, 12, 14) tiene media 11 y distancias 3, 1, 1, 3, así que MAD = 8 ÷ 4 = 2 puntos. Rookie (4, 4, 4, 4) tiene media 4 y todas las distancias son 0, así que MAD = 0 puntos. Starter (5, 15, 5, 15) tiene media 10 y todas las distancias son 5, así que MAD = 5 puntos, la variación más amplia de las tres.
- Warm-up 2Calentamiento 2
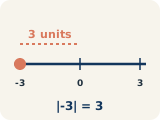
Deviation = 11 − 15 = −4. Absolute deviation = |−4| = 4.Desviación = 11 − 15 = −4. Desviación absoluta = |−4| = 4.
- Warm-up 3Calentamiento 3
Add the distances: 3 + 1 + 1 + 3 = 8. Divide by the 4 games: 8 ÷ 4 = 2. The MAD is 2 points.Suma las distancias: 3 + 1 + 1 + 3 = 8. Divide entre los 4 partidos: 8 ÷ 4 = 2. La MAD es 2 puntos.
- Level up 1Sube de nivel 1
- Shooter A, because a smaller MAD means scores stay closer to the averageTirador A, porque una DMA más pequeña significa que los puntajes se mantienen cerca del promedio
A smaller MAD means a smaller average distance from the mean. Shooter A's MAD of 2 is smaller than Shooter B's 6, so Shooter A is more consistent in these data.Una MAD menor significa una menor distancia promedio a la media. La MAD de 2 del tirador A es menor que la de 6 del tirador B, así que el tirador A es más consistente en estos datos.
- Level up 2Sube de nivel 2
- A strong answer uses: MAD, consistent, spread, lower, higher, predictable, absolute deviation.
Both teams average 75, so compare their MADs. Team A's distances from 75 are 2, 1, 1, 2, 0, totaling 6, so its MAD is 6 ÷ 5 = 1.2 points. Team B's distances are 15, 15, 10, 10, 0, totaling 50, so its MAD is 50 ÷ 5 = 10 points. A coach seeking consistency would prefer Team A because its recorded scores have the smaller average distance from 75. MAD describes an average distance, not a maximum distance for every game.Ambos equipos promedian 75, así que compara sus MAD. Las distancias del equipo A a 75 son 2, 1, 1, 2, 0, que suman 6; su MAD es 6 ÷ 5 = 1.2 puntos. Las distancias del equipo B son 15, 15, 10, 10, 0, que suman 50; su MAD es 50 ÷ 5 = 10 puntos. Un entrenador que busca consistencia preferiría al equipo A porque sus puntajes registrados tienen la menor distancia promedio a 75. La MAD describe una distancia promedio, no una distancia máxima para cada partido.
- Level up 3Sube de nivel 3
- Least to most spread out: Set A: 9, 10, 10, 11 (MAD ≈ 0.5), Set B: 5, 10, 10, 15 (MAD = 2.5), Set C: 1, 10, 10, 19 (MAD = 4.5)
All three sets center on 10, so only the spread separates them. Set A (9, 10, 10, 11) barely moves from the mean, giving a MAD of about 0.5. Set B (5, 10, 10, 15) reaches 5 away on each end for a MAD of 2.5, and Set C (1, 10, 10, 19) reaches 9 away on each end for a MAD of 4.5. Ranking least to most spread out gives A, then B, then C.Los tres conjuntos se centran en 10, así que solo la dispersión los diferencia. El conjunto A (9, 10, 10, 11) casi no se aleja de la media y da un MAD de aproximadamente 0.5. El conjunto B (5, 10, 10, 15) llega a 5 de distancia en cada extremo, con un MAD de 2.5, y el conjunto C (1, 10, 10, 19) llega a 9 de distancia en cada extremo, con un MAD de 4.5. De menos a más disperso el orden es A, luego B, luego C.